Daniel J. Denis - Applied Univariate, Bivariate, and Multivariate Statistics
Здесь есть возможность читать онлайн «Daniel J. Denis - Applied Univariate, Bivariate, and Multivariate Statistics» — ознакомительный отрывок электронной книги совершенно бесплатно, а после прочтения отрывка купить полную версию. В некоторых случаях можно слушать аудио, скачать через торрент в формате fb2 и присутствует краткое содержание. Жанр: unrecognised, на английском языке. Описание произведения, (предисловие) а так же отзывы посетителей доступны на портале библиотеки ЛибКат.

- Название:Applied Univariate, Bivariate, and Multivariate Statistics
- Автор:
- Жанр:
- Год:неизвестен
- ISBN:нет данных
- Рейтинг книги:5 / 5. Голосов: 1
-
Избранное:Добавить в избранное
- Отзывы:
-
Ваша оценка:
Applied Univariate, Bivariate, and Multivariate Statistics: краткое содержание, описание и аннотация
Предлагаем к чтению аннотацию, описание, краткое содержание или предисловие (зависит от того, что написал сам автор книги «Applied Univariate, Bivariate, and Multivariate Statistics»). Если вы не нашли необходимую информацию о книге — напишите в комментариях, мы постараемся отыскать её.
contains an accessible introduction to statistical modeling techniques commonly used in the social and behavioral sciences. The text offers a blend of statistical theory and methodology and reviews both the technical and theoretical aspects of good data analysis.
Featuring applied resources at various levels, the book includes statistical techniques using software packages such as R and SPSS®. To promote a more in-depth interpretation of statistical techniques across the sciences, the book surveys some of the technical arguments underlying formulas and equations. The thoroughly updated edition includes new chapters on nonparametric statistics and multidimensional scaling, and expanded coverage of time series models. The second edition has been designed to be more approachable by minimizing theoretical or technical jargon and maximizing conceptual understanding with easy-to-apply software examples. This important text:
Offers demonstrations of statistical techniques using software packages such as R and SPSS® Contains examples of hypothetical and real data with statistical analyses Provides historical and philosophical insights into many of the techniques used in modern social science Includes a companion website that includes further instructional details, additional data sets, solutions to selected exercises, and multiple programming options Written for students of social and applied sciences,
offers a text to statistical modeling techniques used in social and behavioral sciences.
Applied Univariate, Bivariate, and Multivariate Statistics — читать онлайн ознакомительный отрывок
Ниже представлен текст книги, разбитый по страницам. Система сохранения места последней прочитанной страницы, позволяет с удобством читать онлайн бесплатно книгу «Applied Univariate, Bivariate, and Multivariate Statistics», без необходимости каждый раз заново искать на чём Вы остановились. Поставьте закладку, и сможете в любой момент перейти на страницу, на которой закончили чтение.
Интервал:
Закладка:
2.4.4 Ratio Scale
The most sophisticated scale of measurement is that of the ratio scale. It is the most sophisticated because it is the only scale for which we can speak meaningfully about ratiosbetween competing measurement intervals. By “ratio,” we simply mean we have the power to make such statements as “object a is twice as large as object b .” Up to now, no other scale has allowed us to make such statements. For instance, in the interval scale, concluding that a is any factor greater than b made no sense. We did not have a starting point to base such conclusions. An IQ of zero did not necessarily mean the absenceof intelligence. Rather, it was simply an arbitrary point on the IQ scale presumably denoting a particular quantity of IQ (even if, in all probability, very small).
What gives us license to make statements of ratios? The element of the ratio scale that permits us to make such statements is the fact that the ratio scale has at its origin a true zero point. When something is deemed measurable at the ratio scale, a measurement of zero actually means zero of the thing that is being measured. Was this fact true of the interval scale? No, because zero degrees Fahrenheit did not equate to there being zero temperature. “Zero” was simply an arbitrary value on the scale. However, the fact that I have zero coins in my pocket actually means that I have zerocoins. “Zero” is said to be, in this case, “absolute,” meaning that there is truly nothing there.
Physical quantities such as weight, distance, velocity, motion, are all measurable at the ratio level. Variables such as reaction time in sensation experiments are also measurable at the ratio level. Phenomena such as intelligence, anxiety, attitude, are generally not. More often we deem them measurable at the interval level or less, and when we really get critical, it is even a stretch at times to consider the ordinal level of measurement as being satisfied for such variables. Then again, if we decided to operationally define anxiety by beats per minuteof one's heart, then theoretically at least, one could conclude that an individual has zero anxiety if that individual has zero beats per minute (though of course, this could make for an awkward definition for the absence of anxiety!).
2.5 MATHEMATICAL VARIABLES VERSUS RANDOM VARIABLES
When we speak of a mathematical variable(or simply, variable), we mean a symbol that at any point could be replaced by values contained in a specified set. For instance, consider the mathematical variable y i. By the subscript i is indicated the fact that y istands for a setof values, not all equal to the same number (otherwise y would be a constant) such that at any point in time any of these values in the set could serve as a temporary “replacement” for the symbol.
Of course, social and natural sciences are all about variables. Here are some examples:
Height of persons in the world is a variable because persons of the world have different heights. However, height would be considered a constant if 10 people in a room were of the exact same height (and those were the only people we were considering).
Blood pressure is a variable because persons, animals, and other living creatures have different blood pressure measurements.
Intelligence (IQ) of human beings (difficult to measure to be sure, though psychology has developed instruments in an attempt to assess such things) is a variable because presumably people have differing intellectual capacities.
Earned run average (ERA) of baseball players is a variable because players do not all have the same ERA.
A random variableis a mathematical variable that is associated with a probability distribution. That is, as soon as we assign probabilities to valuesof the variable, we have a random variable. More formally, we can say that a random variable is a function from a sample space into the real numbers(Casella and Berger, 2002), which essentially means that elements in the set (i.e., sample space) have probabilities associated with them (Dowdy, Wearden, and Chilko, 2004).
Consider a simple comparison between a mathematical variable and a discrete random variable in Table 2.4.
Notice that for the mathematical variable, probability does not enter the picture, it is not of any consideration. For the discrete random variable, each value of the variable has a probability associated with it. Note as well that the probabilities must sum to 1.0 for it to be a legitimate probability distribution (i.e., 0.20 + 0.50 + 0.30 = 1.0). How the given probabilities are assigned is a matter to be governed by the specific context of the problem. Recall as well that variables can be classified as discrete or continuous (see Appendix for a review). This same distinction can be applied to random variables as to ordinary mathematical variables. In Table 2.4features a discrete random variable. For continuous random variables, since the probability of any particular value in a continuous distribution is theoretically zero, instead of associating probabilities with particular values, probabilities are associated with areas under the curve computed by way of integration in calculus.
Table 2.4 Mathematical versus Discrete Random Variable
| Mathematical Variable y i | Random Variable y i |
|---|---|
| y 1= 1 | y 1= 1 ( p = 0.20) |
| y 2= 3 | y 2= 3 ( p = 0.50) |
| y 3= 5 | y 3= 5 ( p = 0.30) |
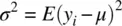
The distinction between mathematical and random variables is important when we discuss such things as means, variances, and covariances. A reader first learning about random variables, having already mastered the concept of sample or population variance (to be discussed shortly), can be somewhat taken aback when encountering the variance of a random variable, given as
and then attempting to compare it to the more familiar variance of a population:
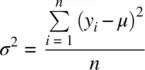
Realize, however, that both expressions are essentially similar, they both account for squared deviations from the mean. However, the variance of a random variable is stated in terms of its expectation, E . Throughout this book, we will see the operator E at work. What is an expectation? The expectation E of a random variable is the meanof that random variable, which amounts to it being a probability‐weighted average (Gill, 2006). The operator E occurs several times throughout this book because in theoretical statistics, long‐run averagesof a statistic are of especial interest. As noted by Feller (1968, p. 221), should an experiment be repeated n times under identical conditions, the average of such trials should be close toexpectation. Perhaps less formally, the operator E then tells us what we might expect to see in the long runfor large n . Theoretical statisticians love taking expectations, because the short run of a variable is seldom of interest at a theoretical level. It is the long (probability) run that is often of most theoretical interest. As a crude analogy, on a personal level, you may be “up” or “down” now, but if your expectation E pointed to a favorable long‐run endpoint, then perhaps that is enough to convince you that though “on the way” is a rough tumbly road, in the end, as the spiritual would say, we “arrive” at our expectation (which perhaps some would denote as an afterlife of sorts).
Читать дальшеИнтервал:
Закладка:
Похожие книги на «Applied Univariate, Bivariate, and Multivariate Statistics»
Представляем Вашему вниманию похожие книги на «Applied Univariate, Bivariate, and Multivariate Statistics» списком для выбора. Мы отобрали схожую по названию и смыслу литературу в надежде предоставить читателям больше вариантов отыскать новые, интересные, ещё непрочитанные произведения.


Обсуждение, отзывы о книге «Applied Univariate, Bivariate, and Multivariate Statistics» и просто собственные мнения читателей. Оставьте ваши комментарии, напишите, что Вы думаете о произведении, его смысле или главных героях. Укажите что конкретно понравилось, а что нет, и почему Вы так считаете.