Pascal Ribéreau-Gayon - Handbook of Enology - Volume 1
Здесь есть возможность читать онлайн «Pascal Ribéreau-Gayon - Handbook of Enology - Volume 1» — ознакомительный отрывок электронной книги совершенно бесплатно, а после прочтения отрывка купить полную версию. В некоторых случаях можно слушать аудио, скачать через торрент в формате fb2 и присутствует краткое содержание. Жанр: unrecognised, на английском языке. Описание произведения, (предисловие) а так же отзывы посетителей доступны на портале библиотеки ЛибКат.
- Название:Handbook of Enology: Volume 1
- Автор:
- Жанр:
- Год:неизвестен
- ISBN:нет данных
- Рейтинг книги:4 / 5. Голосов: 1
-
Избранное:Добавить в избранное
- Отзывы:
-
Ваша оценка:
Handbook of Enology: Volume 1: краткое содержание, описание и аннотация
Предлагаем к чтению аннотацию, описание, краткое содержание или предисловие (зависит от того, что написал сам автор книги «Handbook of Enology: Volume 1»). Если вы не нашли необходимую информацию о книге — напишите в комментариях, мы постараемся отыскать её.
is thus the same. It aims to provide practitioners, winemakers, technicians and enology students with foundational knowledge and the most recent research results. This knowledge can be used to contribute to a better definition of the quality of grapes and wine, a greater understanding of chemical and microbiological parameters, with the aim of ensuring satisfactory fermentations and predicting the evolution of wines, an7thd better mastery of wine stabilization processes. As a result, the purpose of this publication is to guide readers in their thought processes with a view to preserving and optimizing the identity and taste of wine and its aging potential.
This third English edition of
, is an enhanced translation from the 7h French 2017 edition, and is published in print as individual themed volumes and as a two-volume set, describing aspects of winemaking using a detailed, scientific approach. The authors, who are highly-respected enologists, examine winemaking processes, theorizing what constitutes a perfect technique and the proper combination of components necessary to produce a quality vintage. They also illustrate methodologies of common problems, revealing the mechanism behind the disorder, thus enabling a diagnosis and solution.
Volume 1:
The Microbiology of
Wine and Vinifications
Coverage includes: Wine microbiology; Yeasts; Yeast metabolism; The conditions for the development of yeasts; Lactic acid bacteria, their metabolism and their development in wine; Acetic bacteria; The use of sulfur dioxide in the treatment of musts and wines; Products and processes acting in addition to sulfur dioxide; Winemaking; The grape and its maturation; Harvesting and processing of grapes after harvest; Vinification in red and white wine making.
The target audience includes advanced viticulture and enology students, professors and researchers, and practicing grape growers and vintners.
Handbook of Enology: Volume 1 — читать онлайн ознакомительный отрывок
Ниже представлен текст книги, разбитый по страницам. Система сохранения места последней прочитанной страницы, позволяет с удобством читать онлайн бесплатно книгу «Handbook of Enology: Volume 1», без необходимости каждый раз заново искать на чём Вы остановились. Поставьте закладку, и сможете в любой момент перейти на страницу, на которой закончили чтение.
Интервал:
Закладка:
Genetic fingerprinting after hybridization is a more complicated and involved method than mtDNA or karyotype analysis. It is, however, without doubt the most discriminating strain identification method and may even discriminate too well. It has correctly indicated minor differences between very closely related strains. In fact, in the Bordeaux region (Frezier, 1992), S. cerevisiae clones isolated from spontaneous fermentations in different wineries have been encountered, which have the same karyotype and the same mtDNA restriction profile. Yet their hybridization profiles differ depending on sample origin. These strains, probably descendants of the same mother strain, have therefore undergone minor random modifications, maintained during vegetative reproduction.
1.9.5 PCR Associated with δ Sequences
This method consists of using PCR to amplify certain sequences of the yeast genome ( Section 1.8.4), occurring between the repeated δ elements, whose separation distance does not exceed a certain value (1 kb). This method was developed (Ness et al ., 1992; Masneuf and Dubourdieu, 1994; Legras and Karst, 2003) to characterize S. cerevisiae strains. The amplification is carried out directly on whole cells. They are simply heated to make the cell envelopes permeable. The resulting amplification fragments are separated according to their size by agarose gel electrophoresis and viewed using ultraviolet fluorescence ( Figure 1.30).
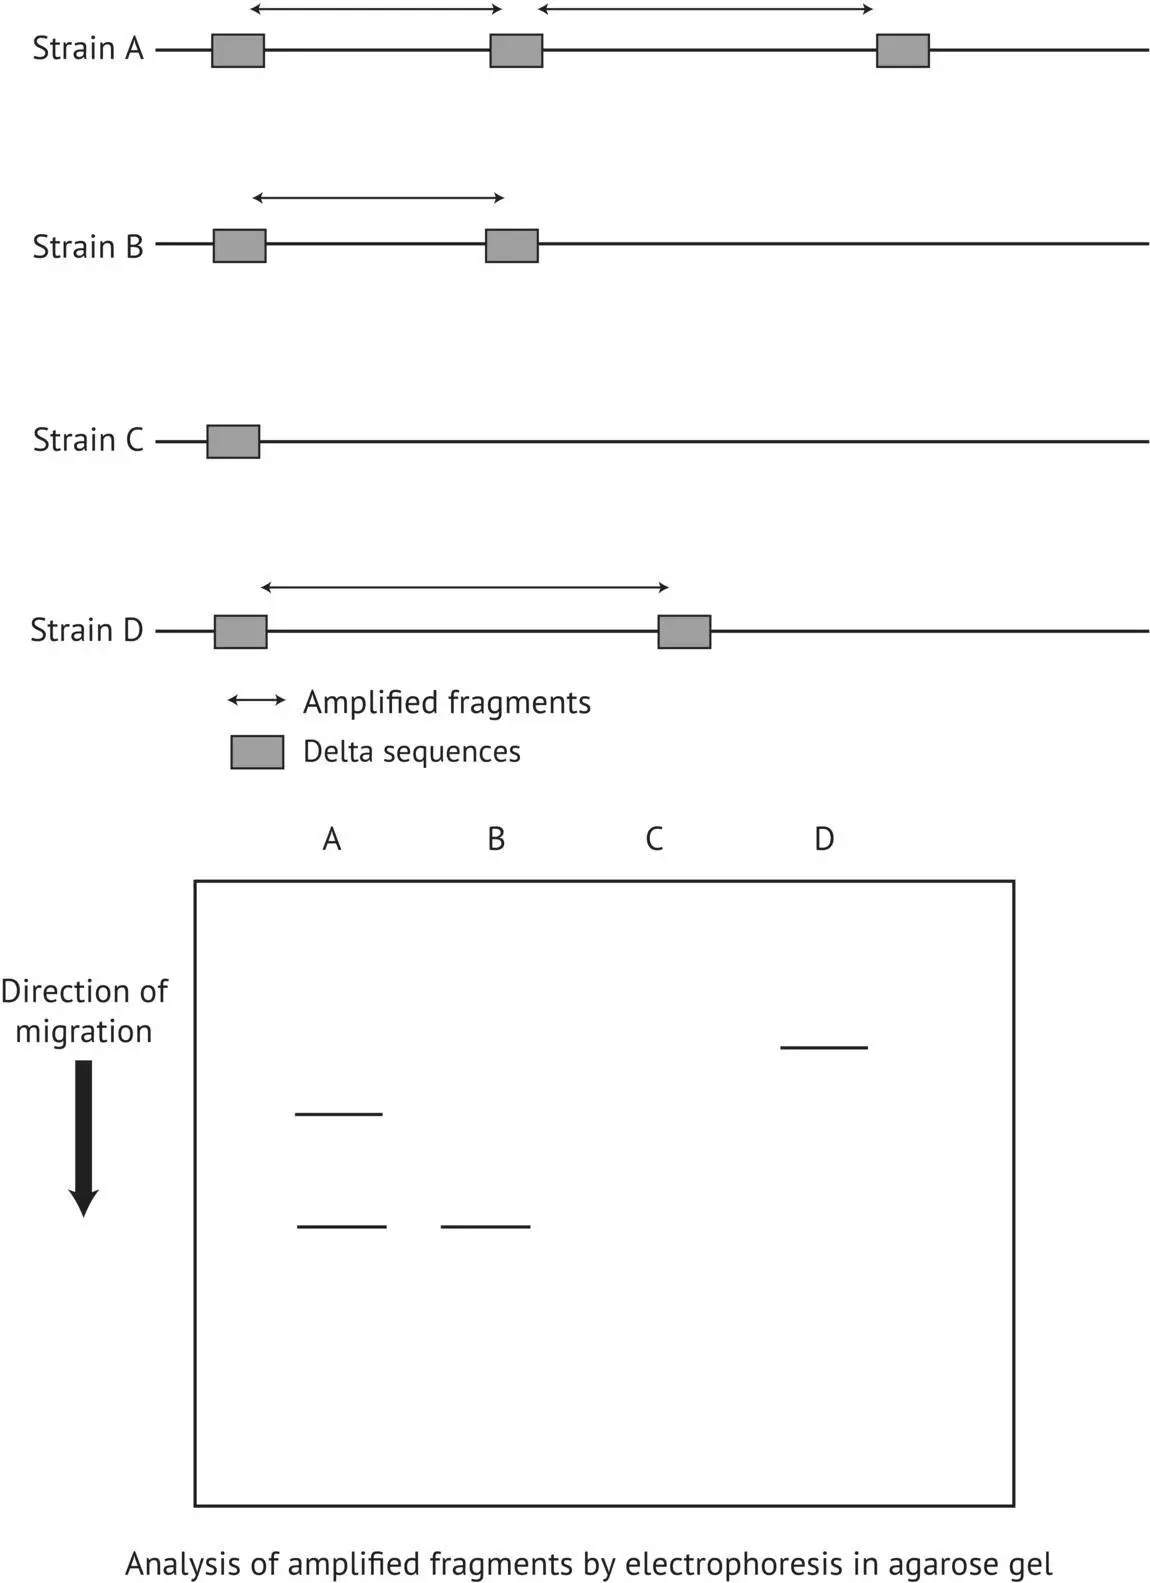
FIGURE 1.30 Principle of identification of S. cerevisiae strains by PCR associated with δ elements.
This analysis can distinguish between most S. cerevisiae ADY strains used in winemaking ( Figure 1.31). Out of the 26 selected commercial yeast strains analyzed, 25 can be differentiated by theirPCR profile associated with δ sequences. Lavallée et al . (1994) also observed excellent discriminating power with this method while analyzing industrially produced commercial strains from Lallemand Inc. (Montreal, Canada). In addition, this method enables the identification of 25–50 strains per day; it is the quickest of the different strain identification techniques currently available. When used for native yeast strain identification in a given viticultural region, however, it seems to be less discriminating than karyotype analysis. PCR profiles of wild yeasts isolated in a given location often appear similar. They have several constant bands and only a small number of variable discriminating bands. Certain strains have the same PCR amplification profile while having different karyotypes. In a given location, the polymorphism witnessed by PCR associated with δ sequences is lower than that of the karyotypes. This method is therefore complementary to other methods for characterizing winemaking strains. PCR enables a rapid primary sorting of a native yeast population. Karyotype analysis refines this discrimination.
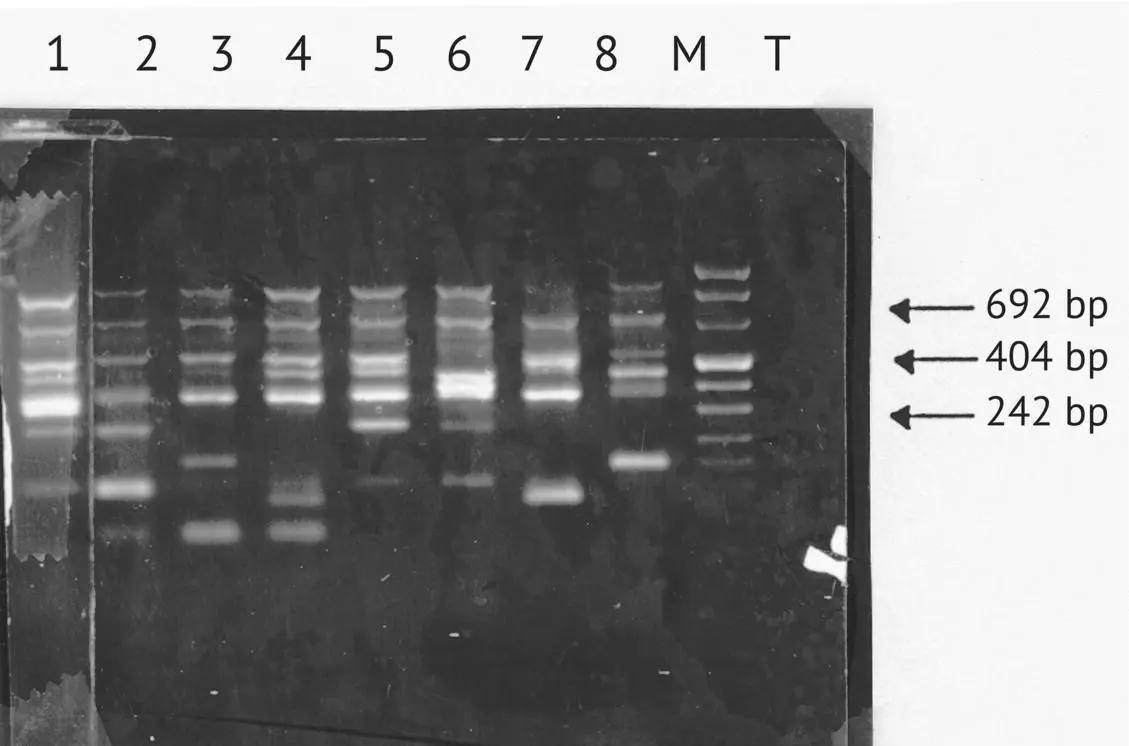
FIGURE 1.31 Electrophoresis in agarose gel (at 1.8%) of amplified fragments obtained from various commercial yeast strains. Band 1, F10; band 2, BO213; band 3, VL3c; band 4, UP30Y5; band 5, 522 D; band 6, EG8; band 7, L‐1597; band 8, WET 136; M, molecular weight marker; T, negative control.
Saccharomyces uvarum strains cannot be distinguished by this technique because their genome contains only a few Ty elements.
Lastly, because of its convenience and rapidity, PCR associated with δ sequences facilitates verification of the implantation of yeast starters used in winemaking. The analyses are conducted on the entire biomass derived from lees, placed beforehand in a liquid medium in a laboratory culture. The amplification profiles obtained are compared with inoculated yeast strain profiles. They are identical with a successful implantation, and different if the inoculation fails. Figure 1.32gives examples of successful (yeasts B and C) and unsuccessful (yeasts A, D, and E) implantations. Contaminating strains have a different amplification profile than the yeast starter.
The detection threshold of a contaminating strain was studied in the laboratory by analyzing a mixture of two strains in variable proportions. In the example given in Figure 1.33, the contaminating strain is easily detected at 1%. In winery fermentations, however, several native strains can coexist with the inoculated strain in small proportions. When must undergoing fermentation or lees is analyzed by PCR, the yeast implantation rate is at least 90% when the amplification profiles of the lees and the yeast starter are identical.
1.9.6 PCR with Microsatellites
Microsatellites are tandem repeat units of short DNA sequences (1–10 nucleotides), i.e. in the same direction and dispersed throughout the eukaryote genome. The number of motif repetitions is extremely variable from one individual to another, making these sequences highly polymorphic in size. These regions are easily identified, thanks to knowledge of the full sequence of the S. cerevisiae genome. Approximately 275 sequences have been listed, mainly AT dinucleotides and AAT and AAC trinucleotides (Field and Wills, 1998; Hennequin et al ., 2001; Perez et al ., 2001). Furthermore, these sequences are allelic markers, transmitted to the offspring in a Mendelian fashion. Consequently, these are ideal genetic markers for identifying specific yeast strains, making it possible not only to distinguish between strains but also to arrange them in related groups. This technique has many applications in humans: paternity tests, forensic medicine, etc. In viticulture, this molecular identification method has already been applied to Vitis vinifera grape varieties (Bowers et al ., 1999).
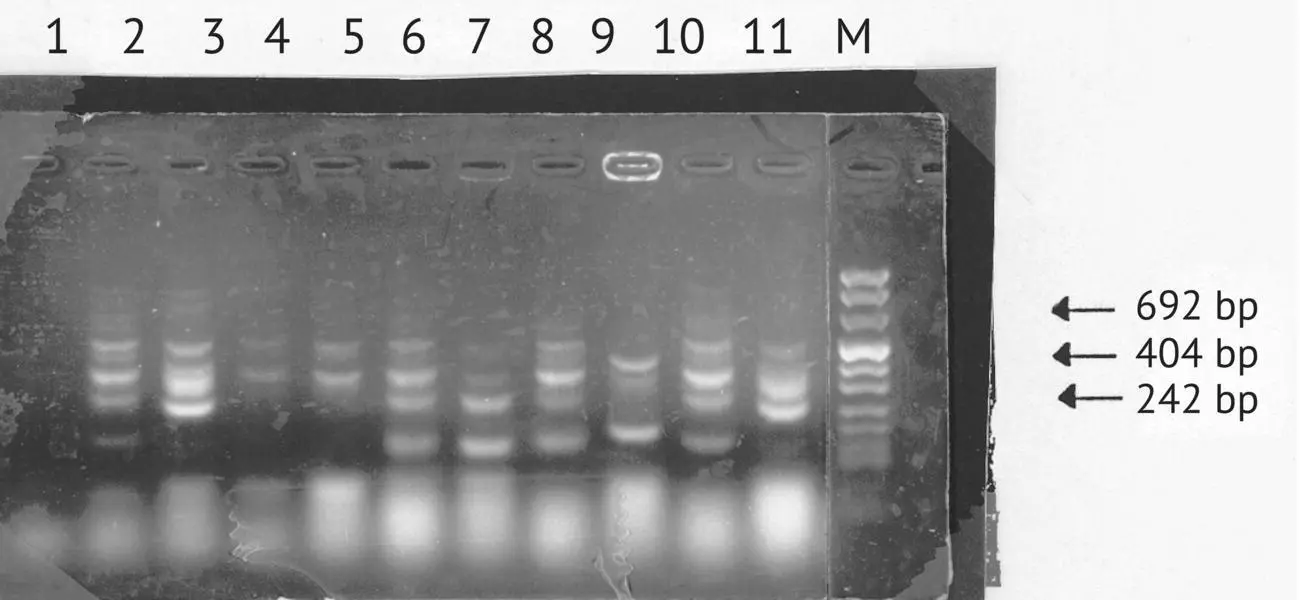
FIGURE 1.32 Electrophoresis in agarose gel (1.8%) of amplified fragments illustrating examples of yeast implantation tests (successful: yeasts B and C; unsuccessful: yeasts A, D, and E). Band 1, negative control; band 2, lees A; band 3, ADY A; band 4, lees B; band 5, ADY B; band 6, lees C; band 7, ADY C; band 8, lees D; band 9, ADY D; band 10, lees E; band 11, ADY E; M, molecular weight marker.
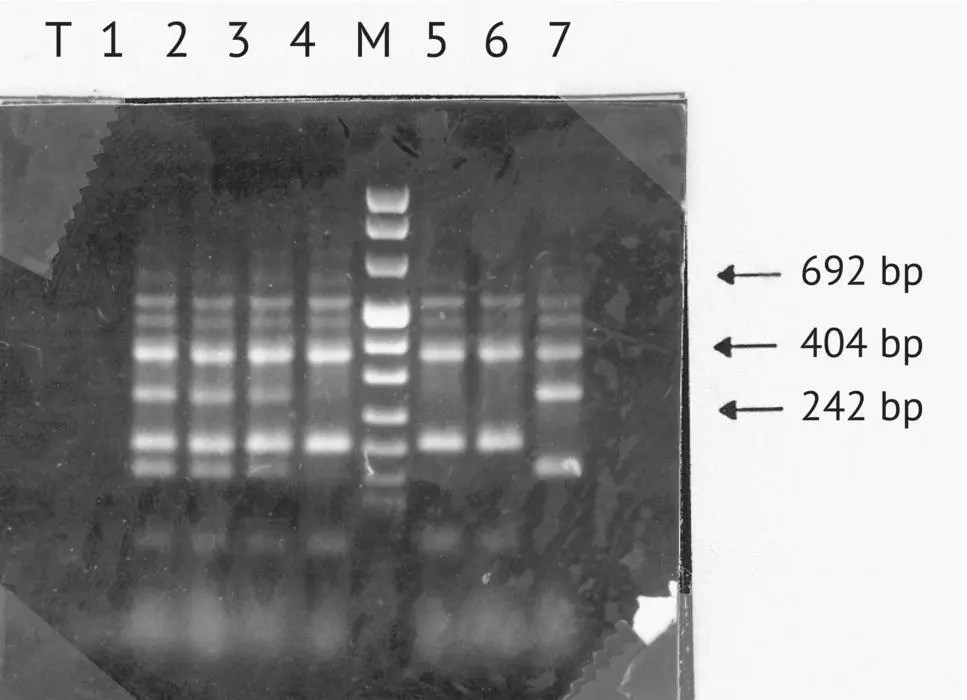
FIGURE 1.33 Determination of the detection threshold of a contaminating strain. T, negative control; band 1, strain A 70%, strain B 30%; band 2, strain A 80%, strain B 20%; band 3, strain A 90%, strain B 10%; band 4, strain A 99%, strain B 1%; M, molecular weight marker; band 5, strain A 99.9%, strain B 0.1%; band 6, strain A; band 7, strain B.
The technique consists in amplifying the region of the genome containing these microsatellites, and then analyzing the size of the amplified portion to a level of detail of one nucleotide by capillary electrophoresis. This size varies by a certain number of base pairs (approximately 8–40) from one strain to another, depending on the number of times the motif is repeated. A yeast strain may be heterozygous for a given locus, giving two different‐sized amplified DNA fragments. Using six microsatellites, Perez et al . (2001) were able to identify 44 different genotypes within a population of 51 strains of S. cerevisiae used in winemaking. Other authors (Gonzalez Techera et al ., 2001; Hennequin et al ., 2001, Klis et al ., 2002) have shown that the strains of S. cerevisiae used in winemaking are weakly heterozygous for the loci studied. However, interstrain variability of the microsatellites is very high. The results are expressed in numerical values for the size of the microsatellite in base pairs or the number of repetitions of the motifs on each allele. These digital data are easy to interpret, unlike the karyotype images on agarose gel, which are not really comparable from one laboratory to another. Based on 41 microsatellites, Legras et al . (2005) selected six very discriminating and reproducible loci. They highlight the relationships between strains from different geographical zones or industrial environments.
Читать дальшеИнтервал:
Закладка:
Похожие книги на «Handbook of Enology: Volume 1»
Представляем Вашему вниманию похожие книги на «Handbook of Enology: Volume 1» списком для выбора. Мы отобрали схожую по названию и смыслу литературу в надежде предоставить читателям больше вариантов отыскать новые, интересные, ещё непрочитанные произведения.


Обсуждение, отзывы о книге «Handbook of Enology: Volume 1» и просто собственные мнения читателей. Оставьте ваши комментарии, напишите, что Вы думаете о произведении, его смысле или главных героях. Укажите что конкретно понравилось, а что нет, и почему Вы так считаете.