Pascal Ribéreau-Gayon - Handbook of Enology - Volume 1
Здесь есть возможность читать онлайн «Pascal Ribéreau-Gayon - Handbook of Enology - Volume 1» — ознакомительный отрывок электронной книги совершенно бесплатно, а после прочтения отрывка купить полную версию. В некоторых случаях можно слушать аудио, скачать через торрент в формате fb2 и присутствует краткое содержание. Жанр: unrecognised, на английском языке. Описание произведения, (предисловие) а так же отзывы посетителей доступны на портале библиотеки ЛибКат.
- Название:Handbook of Enology: Volume 1
- Автор:
- Жанр:
- Год:неизвестен
- ISBN:нет данных
- Рейтинг книги:4 / 5. Голосов: 1
-
Избранное:Добавить в избранное
- Отзывы:
-
Ваша оценка:
Handbook of Enology: Volume 1: краткое содержание, описание и аннотация
Предлагаем к чтению аннотацию, описание, краткое содержание или предисловие (зависит от того, что написал сам автор книги «Handbook of Enology: Volume 1»). Если вы не нашли необходимую информацию о книге — напишите в комментариях, мы постараемся отыскать её.
is thus the same. It aims to provide practitioners, winemakers, technicians and enology students with foundational knowledge and the most recent research results. This knowledge can be used to contribute to a better definition of the quality of grapes and wine, a greater understanding of chemical and microbiological parameters, with the aim of ensuring satisfactory fermentations and predicting the evolution of wines, an7thd better mastery of wine stabilization processes. As a result, the purpose of this publication is to guide readers in their thought processes with a view to preserving and optimizing the identity and taste of wine and its aging potential.
This third English edition of
, is an enhanced translation from the 7h French 2017 edition, and is published in print as individual themed volumes and as a two-volume set, describing aspects of winemaking using a detailed, scientific approach. The authors, who are highly-respected enologists, examine winemaking processes, theorizing what constitutes a perfect technique and the proper combination of components necessary to produce a quality vintage. They also illustrate methodologies of common problems, revealing the mechanism behind the disorder, thus enabling a diagnosis and solution.
Volume 1:
The Microbiology of
Wine and Vinifications
Coverage includes: Wine microbiology; Yeasts; Yeast metabolism; The conditions for the development of yeasts; Lactic acid bacteria, their metabolism and their development in wine; Acetic bacteria; The use of sulfur dioxide in the treatment of musts and wines; Products and processes acting in addition to sulfur dioxide; Winemaking; The grape and its maturation; Harvesting and processing of grapes after harvest; Vinification in red and white wine making.
The target audience includes advanced viticulture and enology students, professors and researchers, and practicing grape growers and vintners.
Handbook of Enology: Volume 1 — читать онлайн ознакомительный отрывок
Ниже представлен текст книги, разбитый по страницам. Система сохранения места последней прочитанной страницы, позволяет с удобством читать онлайн бесплатно книгу «Handbook of Enology: Volume 1», без необходимости каждый раз заново искать на чём Вы остановились. Поставьте закладку, и сможете в любой момент перейти на страницу, на которой закончили чтение.
Интервал:
Закладка:
The extraction of mtDNA comprises several stages. The protoplasts obtained by enzymatic digestion of the cell walls are lysed in a hypotonic buffer. The mtDNA is then separated from the chromosomal DNA by ultracentrifugation in a cesium chloride gradient, in the presence of bisbenzimide, which acts as a fluorescent intercalating stain. This agent amplifies the difference in density between chromosomal DNA and mtDNA. The mtDNA has a high number of adenine and thymine base pairs, for which bisbenzimide has a strong affinity. Finally, the mtDNA is purified by a phenol–chloroform extraction and an ethanol precipitation.
Defontaine et al . (1991) and Querol et al . (1992) simplified this protocol by separating the mitochondria from the other cell constituents before extracting the DNA. In this manner, they avoided the ultracentrifugation step. The coarse cellular debris is eliminated from the yeast lysate by centrifuging at 1,000 g. The supernatant is then recentrifuged at 15,000 g to obtain the mitochondria. The mitochondria are then lysed in a suitable buffer to liberate the DNA.
Unlike the industrial brewer's yeast strains analyzed by Aigle et al . (1984), which have the same mtDNA restriction profile, implying that they are of common origin, the winemaking yeast strains have a large degree of mtDNA diversity. This method easily differentiates between most of the selected yeasts used in winemaking as well as wild strains of S. cerevisiae found in spontaneous fermentations ( Figure 1.26). This method may also help differentiate S. uvarum strains (Naumova et al ., 2010).
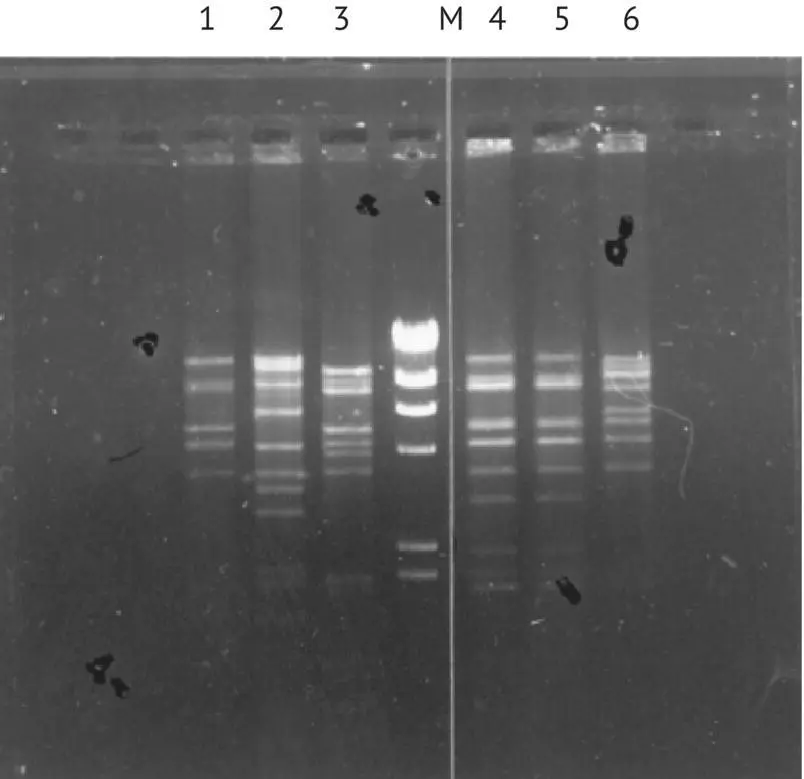
FIGURE 1.26 Restriction profile by Eco R5 of mtDNA of different strains of S. cerevisiae . Band 1, FIO; band 2, BO213; band 3, VLI; M, marker; band 4, 522; band 5, Sita 3; band 6, VL3c.
This technique is very discriminating and not too expensive, but it is long and requires several complex manipulations. It is useful for the subtle characterization of a small number of strains. Inoculation effectiveness can also be verified by this method. In the laboratory, the lees, sampled during or toward the end of alcoholic fermentation, are cultured in a liquid medium. The mtDNA restriction profiles of this total biomass and of the yeast starter strain are compared. The absence of any extra bands, with respect to the yeast starter strain restriction profile, demonstrates that the yeast starter has been properly implanted, with an accuracy of 90%. In fact, in the case of a binary mixture, the minority strain must represent around 10% of the total population to be detected (Hallet et al ., 1989).
1.9.3 Karyotype Analysis
Saccharomyces cerevisiae has 16 chromosomes with a size range between 250 and 2,500 kb. Its genomic DNA is very polymorphic; thus, it is possible to differentiate strains of the species according to the size distribution of their chromosomes. Pulsed‐field electrophoresis is used to separate S. cerevisiae chromosomes and to compare karyotypes of the strains. This technique uses two electric fields oriented differently (90–120°). The electrodes placed on the sides of the apparatus apply the fields alternately ( Figure 1.27).
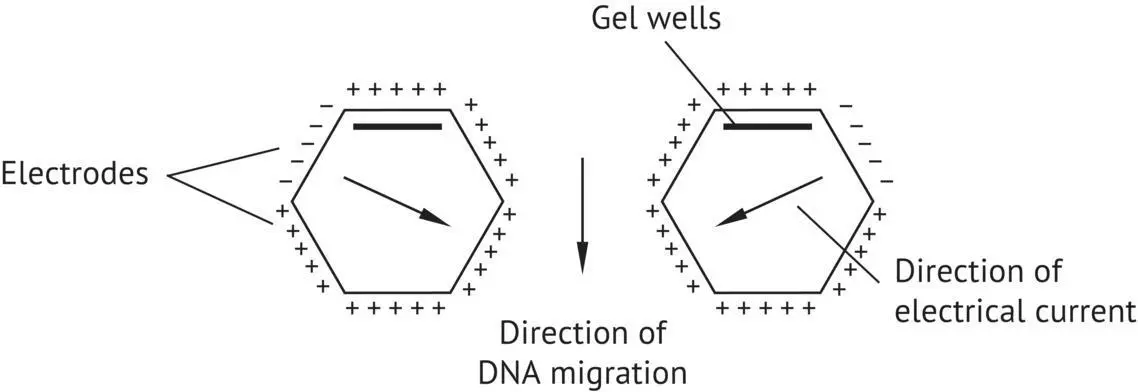
FIGURE 1.27 CHEF pulsed‐field electrophoresis device ( contour clamped electrophoresis field ).
The user can define the duration of the electric current that will be applied in each direction (pulse). With each change in the direction of the electric field, the DNA molecules reorient themselves; the smaller chromosomes reorient themselves more quickly than the larger ones ( Figure 1.28).
Blondin and Vezhinet (1988), Petering et al . (1988), and Dubourdieu and Frezier (1990) applied this technique to identify wine yeast strains. Sample preparation is relatively easy. The yeasts are cultivated in a liquid medium, collected during the log phase, and then placed in suspension in a warm agarose solution that is poured into a partitioned mold to form small plugs.
Figure 1.29gives an example of the identification of S. cerevisiae strains isolated from a grape must undergoing spontaneous fermentation. Vezhinet et al . (1990) have shown that karyotype analysis can distinguish between strains of S. cerevisiae as well or better than the use of mtDNA restriction profiles. Furthermore, karyotype analysis is much quicker and easier to use than mtDNA analysis. In the case of ecological studies of spontaneous fermentation microflora, pulsed‐field electrophoresis of chromosomes is extensively used today to characterize strains of S. cerevisiae (Frezier and Dubourdieu, 1992; Versavaud et al ., 1993, 1995).
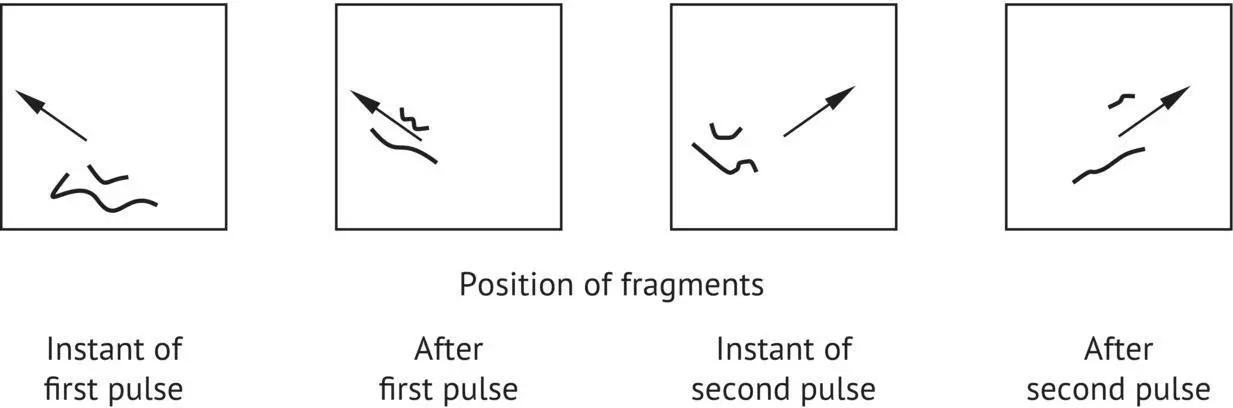
FIGURE 1.28 Mechanism of DNA molecule separation by pulsed‐field electrophoresis.
Very little research on the chromosomal polymorphism in other species of grape and wine yeasts is currently available. Naumov et al . (1993) suggested that S. uvarum and S. cerevisiae karyotypes can be easily distinguished. Other authors (Vaughan Martini and Martini, 1993; Masneuf, 1996) have confirmed their results. In fact, a specific chromosomal band systematically appears in S. uvarum . Furthermore, there are only two chromosomes whose sizes are less than 400 kb in S. uvarum but generally more in S. cerevisiae , in all of the strains that we have analyzed.
Non‐ Saccharomyces species, in particular apiculate yeasts ( H. uvarum and K. apiculata ), are present on grapes and are sometimes found at the beginning of fermentations. These species have fewer polymorphic karyotypes and fewer bands than in Saccharomyces . Versavaud et al . (1993) differentiated between strains of apiculate yeast species and Candida famata by using restriction endonucleases at rare sites ( Not 1 and Sfi 1). The endonucleases cut the chromosomes into a limited number of fragments, which were then separated by pulse‐field electrophoresis.
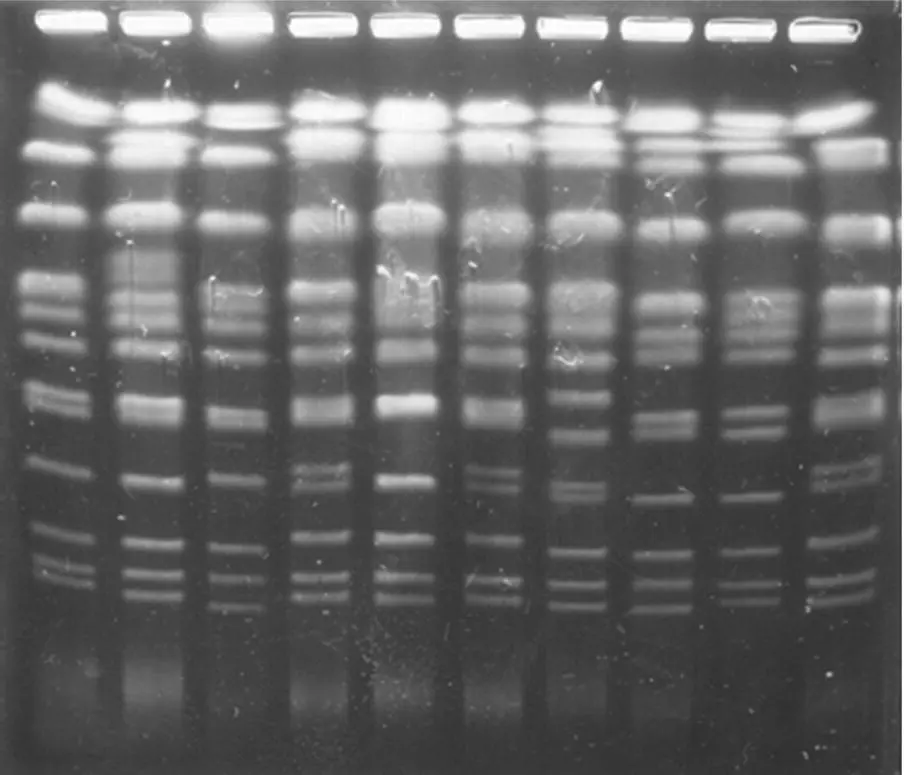
FIGURE 1.29 Example of electrophoretic (pulsed field) profile of S. cerevisiae strain karyotypes.
1.9.4 Genomic DNA Restriction Profile Analysis Associated with DNA Hybridization by Specific Probes (Fingerprinting)
The yeast genome contains DNA sequences that repeat from dozens to hundreds of times, such as the δ sequences or Y1 elements of the chromosome telomeres. The distribution, or more specifically, the number and location of these elements, has a certain intraspecific variability. This genetic fingerprint is used to identify strains (Pedersen, 1986; Degre et al ., 1989).
The yeast strains are cultivated in a liquid medium and are sampled during the log phase, as in the preceding techniques. The entire DNA is isolated and digested by restriction endonucleases. The generated fragments are separated by electrophoresis on agarose gel and then transferred to a nylon membrane (Southern, 1975). Complementary radioactive probes (nucleotide sequences taken from δ and Y1 elements) are used to hybridize with fragments having homologous sequences. The result gives a hybridization profile containing several bands.
Читать дальшеИнтервал:
Закладка:
Похожие книги на «Handbook of Enology: Volume 1»
Представляем Вашему вниманию похожие книги на «Handbook of Enology: Volume 1» списком для выбора. Мы отобрали схожую по названию и смыслу литературу в надежде предоставить читателям больше вариантов отыскать новые, интересные, ещё непрочитанные произведения.


Обсуждение, отзывы о книге «Handbook of Enology: Volume 1» и просто собственные мнения читателей. Оставьте ваши комментарии, напишите, что Вы думаете о произведении, его смысле или главных героях. Укажите что конкретно понравилось, а что нет, и почему Вы так считаете.