Applied Modeling Techniques and Data Analysis 2
Здесь есть возможность читать онлайн «Applied Modeling Techniques and Data Analysis 2» — ознакомительный отрывок электронной книги совершенно бесплатно, а после прочтения отрывка купить полную версию. В некоторых случаях можно слушать аудио, скачать через торрент в формате fb2 и присутствует краткое содержание. Жанр: unrecognised, на английском языке. Описание произведения, (предисловие) а так же отзывы посетителей доступны на портале библиотеки ЛибКат.
- Название:Applied Modeling Techniques and Data Analysis 2
- Автор:
- Жанр:
- Год:неизвестен
- ISBN:нет данных
- Рейтинг книги:5 / 5. Голосов: 1
-
Избранное:Добавить в избранное
- Отзывы:
-
Ваша оценка:
Applied Modeling Techniques and Data Analysis 2: краткое содержание, описание и аннотация
Предлагаем к чтению аннотацию, описание, краткое содержание или предисловие (зависит от того, что написал сам автор книги «Applied Modeling Techniques and Data Analysis 2»). Если вы не нашли необходимую информацию о книге — напишите в комментариях, мы постараемся отыскать её.
Applied Modeling Techniques and Data Analysis 2 — читать онлайн ознакомительный отрывок
Ниже представлен текст книги, разбитый по страницам. Система сохранения места последней прочитанной страницы, позволяет с удобством читать онлайн бесплатно книгу «Applied Modeling Techniques and Data Analysis 2», без необходимости каждый раз заново искать на чём Вы остановились. Поставьте закладку, и сможете в любой момент перейти на страницу, на которой закончили чтение.
Интервал:
Закладка:
Finally, Ross Quinlan’s C4.5 decision tree algorithm is used to build the base classifiers within the bagging process.
Figure 1.5puts all the pieces of our models together.
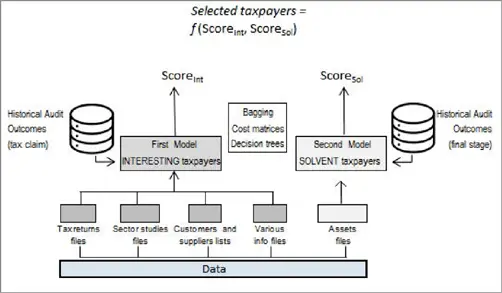
Figure 1.5. The two models together
1.3. Results
Our first model predicts, on the basis of the available features, 415 taxpayers to be interesting (i.e. 15.5% of the entire test set), with a precision rate of about 80%, as shown in Figure 1.6.
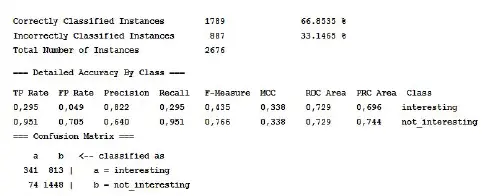
Figure 1.6. First model statistics and confusion matrix
In terms of tax claim amounts, the model appears to perform quite well, since the selected taxpayers’ average due additional taxes amounts to € 49,094, whereas the average on the entire test set is equal to € 22,339.
So far, we have shown that our model, on average, is able to distinguish serious tax evasion phenomena from the less significant ones. But what about the tax collection issue? To deal with this matter, we should investigate what kind of taxpayers we have just selected. For this purpose, Table 1.3shows that the majority of the taxpayers, the model would select, would also be subject to coercive procedures (as we can see, the sum of the values of each column is 100%).
Table 1.3. Predicted values versus actual coercive procedures
| Pred Interesting Not Interesting | ||
| Act | ||
| Procedure | 70.12% | 32.24% |
| No procedure | 29.88% | 67.76% |
Thus, many of the selected taxpayers have a debt payment issue. This jeopardizes the overall selection process efficiency and effectiveness. As pointed out by the Italian Court of Auditors, coercive procedures, on average, are able to collect only about 5% of the overall claimed credits.
To evaluate the problem extent, we can replace the actual tax claim value corresponding to the problematic taxpayers with the estimated collectable tax , which is equal to the tax claim multiplied by a discount factor of 95%, and compare the two scenarios, as in Figures 1.7and 1.8, where we depict both the total tax claim and the average tax claim arising from the taxpayers’ notices in the entire test set.
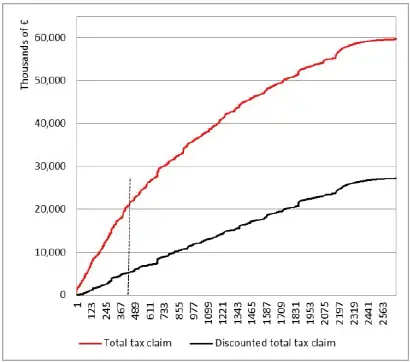
Figure 1.7. Total tax claim and discounted tax claim. For a color version of this figure, see www.iste.co.uk/dimotikalis/analysis2.zip
Taxpayers are ordered, from left to right, according to their probability of being interesting , as calculated by our model. Figure 1.7, for instance, depicts the cumulative tax claim charged up to a certain taxpayer: the red line values refer to the additional taxes requested with the tax notices, while the black line is drawn by considering the discounted values. The dashed vertical line indicates the levels corresponding to the last selected taxpayer according to the model (in our case, the 415th). Recall that when associating a class label with a record, the model also provides a probability, which highlights how confident the model is about its own prediction. Therefore, to a certain extent, it sets a ranking among taxpayers, which we can exploit to draw Figures 1.7and 1.8. As we can easily observe, the overall tax claim charged to the selected taxpayers plummets from € 20 million to € 5 million, and the average tax claim , depicted in Figure 1.8, from € 49,000 to € 12,000. Thus, the selection process, which relied on our data mining model and at first sight seemed to be very efficient, shows some important flaws that we need to face. In fact, tax collectability is not adequately guaranteed.
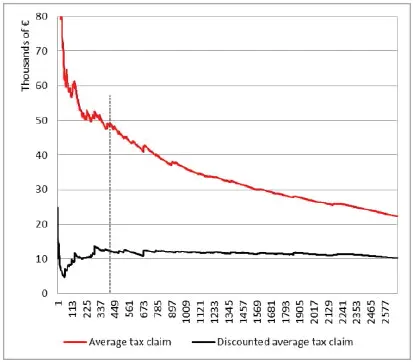
Figure 1.8. Average total tax claim and discounted tax claim. For a color version of this figure, see www.iste.co.uk/dimotikalis/analysis2.zip
A second model may then help us by predicting which taxpayers would not be subject to coercive procedures, by focusing on a set of features concerning their assets.
Again, with a precision rate of about 80%, as shown in Figure 1.9, the model appears to be successful.
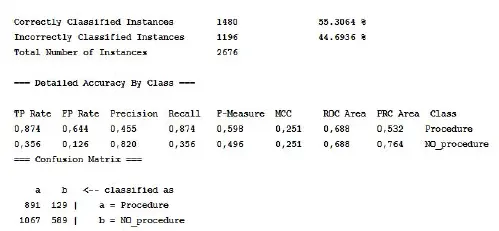
Figure 1.9. Second model statistics and confusion matrix
Table 1.4. Predicted coercive procedures versus actual interesting taxpayers
| Pred Procedure No Procedure | ||
| Act | ||
| Interesting | 46.94% | 32.73% |
| Not interesting | 53.06% | 67.27% |
This second model could be useful on our end, even though it may have some caveats . First, most of the taxpayers that the model classifies as people that will not face a coercive procedure are also not interesting , as shown in Table 1.4. Again, the sum of the values of each column is 100%.
In fact, this second model’s performance in terms of tax claim appears to have worsened with respect to the first, since the no procedure taxpayers’ average due additional tax, calculated on the first 415 taxpayers (according to the ranking set by this model, which is, obviously, dramatically different from the one set by the first model we have seen), is equal to € 20,388. However, the average collectable tax claim is equal to € 13,493, which is a little bit better than the one we have seen before.
We point out that throughout this chapter, we have compared sets of selected taxpayers with the same cardinality, for two kinds of considerations: first, tax authorities, reasonably, have a fixed budget of audits to perform, so comparisons between models should be done subject to a given number of audits; second, for comparability reasons, since smaller sets tend to perform more (see Figure 1.8, where the average tax claim decreases while the number of selected taxpayers increases).
Therefore, in this second model we have developed, the high rate of not interesting taxpayers , on one hand, causes a drop in the average tax claim (from 49,000 to 20,000), but, on the other, it contributes to the slight enhancement of the discounted average tax claim (from € 12,000 to € 13,000), since only a few of the not interesting taxpayers pass through a coercive procedure. Figure 1.10compares, for each number of selected taxpayers, the different coercive procedures rates arising from the two models.
What we can do, then, is use the two models “together”. For instance, we could exploit the first model in order to sort the taxpayers eligible to be selected and the second one to discard the ones likely to be subject to coercive procedures.
In such a way, if we imagine that we select our 415 taxpayers again, on one hand, we would select both interesting and not interesting taxpayers (only if the second model had predicted that no interesting taxpayers would go through a coercive procedure, we would have selected only interesting taxpayers), but, on the other, we would also select the taxpayers who are more likely to pay their tax debts.
Читать дальшеИнтервал:
Закладка:
Похожие книги на «Applied Modeling Techniques and Data Analysis 2»
Представляем Вашему вниманию похожие книги на «Applied Modeling Techniques and Data Analysis 2» списком для выбора. Мы отобрали схожую по названию и смыслу литературу в надежде предоставить читателям больше вариантов отыскать новые, интересные, ещё непрочитанные произведения.


Обсуждение, отзывы о книге «Applied Modeling Techniques and Data Analysis 2» и просто собственные мнения читателей. Оставьте ваши комментарии, напишите, что Вы думаете о произведении, его смысле или главных героях. Укажите что конкретно понравилось, а что нет, и почему Вы так считаете.