Applied Modeling Techniques and Data Analysis 2
Здесь есть возможность читать онлайн «Applied Modeling Techniques and Data Analysis 2» — ознакомительный отрывок электронной книги совершенно бесплатно, а после прочтения отрывка купить полную версию. В некоторых случаях можно слушать аудио, скачать через торрент в формате fb2 и присутствует краткое содержание. Жанр: unrecognised, на английском языке. Описание произведения, (предисловие) а так же отзывы посетителей доступны на портале библиотеки ЛибКат.

- Название:Applied Modeling Techniques and Data Analysis 2
- Автор:
- Жанр:
- Год:неизвестен
- ISBN:нет данных
- Рейтинг книги:5 / 5. Голосов: 1
-
Избранное:Добавить в избранное
- Отзывы:
-
Ваша оценка:
Applied Modeling Techniques and Data Analysis 2: краткое содержание, описание и аннотация
Предлагаем к чтению аннотацию, описание, краткое содержание или предисловие (зависит от того, что написал сам автор книги «Applied Modeling Techniques and Data Analysis 2»). Если вы не нашли необходимую информацию о книге — напишите в комментариях, мы постараемся отыскать её.
Applied Modeling Techniques and Data Analysis 2 — читать онлайн ознакомительный отрывок
Ниже представлен текст книги, разбитый по страницам. Система сохранения места последней прочитанной страницы, позволяет с удобством читать онлайн бесплатно книгу «Applied Modeling Techniques and Data Analysis 2», без необходимости каждый раз заново искать на чём Вы остановились. Поставьте закладку, и сможете в любой момент перейти на страницу, на которой закончили чтение.
Интервал:
Закладка:
Table 1.1. Tax claim, interesting and not interesting taxpayers
| Not interesting | Interesting | |||||
| Tax claim | Num | Total tax claim | Average | Num | Total tax claim | Average |
| [0 - 1] | 736 | 322 | 0.44 | 0 | 0 | 0.00 |
| [1 - 2] | 631 | 942 | 1.49 | 0 | 0 | 0.00 |
| [2 - 5] | 1,607 | 5,409 | 3.37 | 138 | 563 | 4.08 |
| [5 - 10] | 1,127 | 7,727 | 6.86 | 517 | 4,157 | 8.04 |
| [10 - 20] | 446 | 5,911 | 13.25 | 902 | 13,139 | 14.57 |
| [20 - 50] | 0 | 0 | 0.00 | 1,164 | 36,056 | 30.98 |
| [50 - 100] | 0 | 0 | 0.00 | 433 | 30,055 | 69.41 |
| [100+] | 0 | 0 | 0.00 | 327 | 101,987 | 311.89 |
| Total | 4,547 | 20,311 | 4.47 | 3,481 | 185,957 | 53.42 |
1.2.3. Enforced tax recovery proceedings
What happens if a taxpayer does not spontaneously pay the additional tax amount he is charged? Well, after a while, coercive collection procedures will be deployed by the tax authorities. However, as we have seen above, these procedures are highly ineffective, as they only collect about the 5% of the overall credits claimed against the audited taxpayers.
Indeed, data shows that coercive procedures take place in almost 40% of cases, although its distribution is not uniform: they are more frequent if the tax bill is high, as reported in Table 1.2(again, tax claim values are in thousands of euros).
Table 1.2. Number of coercive procedures per tax claim interval
| Tax claim | Coercive procedures | Total | |
| No | Yes | ||
| [0 - 1] | 578 | 158 | 736 |
| [1 - 2] | 476 | 155 | 631 |
| [2 - 5] | 1,268 | 477 | 1,745 |
| [5 - 10] | 1,072 | 572 | 1,644 |
| [10 - 20] | 745 | 603 | 1,348 |
| [20 - 50] | 511 | 653 | 1,164 |
| [50 - 100] | 159 | 274 | 433 |
| [100+] | 90 | 237 | 327 |
| Total | 4,899 | 3,129 | 8,028 |
Table 1.2is actually a double frequency table, which can be used to investigate the existing relationship between the two categorical variables, Coercive procedures and Tax claim (they both take on values that are labels). Recall that given characters X and Y, X is independent from Y if for all Y values, the relative distribution of X does not change. Therefore, a quick glance at Table 1.2shows that Coercive procedures depend on the values taken by Tax claim .
In a more formal way, following the Openstax (2013) notation, we could also perform a test of independence for these variables, by using the well-known test statistic for a test of independence:
where O is the observed value, E is the expected value, calculated as (row total)(column total) over total number surveyed.
Given the values in Table 1.2, the test would let us reject the hypothesis of the two variables being independent at a 1% level of significance: therefore, from the data, there is sufficient evidence to conclude that Coercive procedures are dependent on the Tax claim level.
It is easy to calculate, from Table 1.2, for each tax claim interval, the total coercive procedures rate, the tax notices rate and the coercive procedures within that tax claim interval rate (all of these ratios are depicted in Figure 1.4).
A close look at Figure 1.4shows that until the tax claim is “low” (less than € 10,000; please note that the intervals are in thousands of euros), the blue line, i.e. the percentage of tax notices, is above the purple one, i.e. the percentage of coercive procedures, while for higher values of tax claim, the blue line is under the purple one. This is quite strong evidence that coercive procedures are not independent from tax claim.
As a result, the red line shows that the higher the tax claim, the higher the percentage of procedures within the tax claim range itself, up to over 70% in the last and, apparently, most desirable range.
Therefore, with just one model in place, whose task is to recognize interesting taxpayers, the tax authorities would risk facing many cases of coercive procedures. Thus their ability to ensure tax collection may be seriously jeopardized.
We therefore need to find a way to discover, among the most interesting taxpayers, the most solvent ones, the most willing to pay.
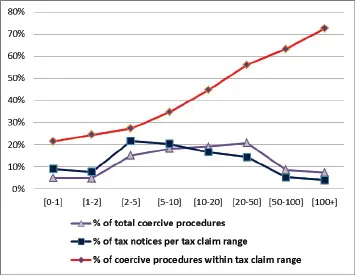
Figure 1.4. Coercive procedures and tax claim. For a color version of this figure, see www.iste.co.uk/dimotikalis/analysis2.zip
We can start by observing that a taxpayer with no properties will probably not be willing to pay his dues. Therefore, a second model only focusing on a few features indicating whether the taxpayer owned some kind of assets or not is built, in order to predict if a tax notice will end in an enforced recovery proceeding or not.
Once both models are available, the taxpayer selection process is held in such a way that undertakings will only be audited if judged worthy by both models.
1.2.4. The models
Our selection strategy needs to take into account two competing demands: on one hand, tax notices must be profitable , i.e. they have to address serious tax fraud or the tax evasion phenomena; on the other, tax collectability must be guaranteed in order to justify all of the tax authorities’ efforts.
To this purpose, we develop two models, both in the form of classification trees: the first one predicts whether a taxpayer is interesting or not, while the second predicts the final stage of a tax notice, distinguishing between those ending with an enforced recovery proceeding and the others, where such enforced recovery proceedings do not take place.
The first one’s attributes are taken from several datasets run by the IRA and are related to the taxpayers’ tax returns and their annexes (such as the sector studies) , their properties details, their customers and suppliers lists and their tax notices, whereas the second one only focuses on a set of features concerning taxpayers’ assets.
In the taxpayer selection process, models that are easier to interpret are preferred to more complex models. Typically, decision trees meet the above requested conditions, so both of our models take that form.
In both cases, instead of considering just one decision tree, both practical and theoretical reasons (Breiman 1996) lead us towards a more sophisticated technique, known as bagging , which stands for bootstrap aggregating, with which many base classifiers are computed (in our case, many trees).
Moreover, a cost matrix is used while building the models. Indeed, in our context, to classify an actual not interesting taxpayer as interesting is a much more serious error than that of classifying as an actual interesting taxpayer as not interesting , based on the fact that, generally, tax offices’ human resources are barely sufficient to perform all of the audits they are assigned. Therefore, as long as offices audit interesting taxpayers, everything is fine, even though many interesting taxpayers may not be considered. In the same way, to predict that a tax notice will not end in a coercive procedure when it actually does, is a much more serious error than that of classifying a tax notice final stage the other way round. Therefore, different weights are given to different misclassification errors.
Читать дальшеИнтервал:
Закладка:
Похожие книги на «Applied Modeling Techniques and Data Analysis 2»
Представляем Вашему вниманию похожие книги на «Applied Modeling Techniques and Data Analysis 2» списком для выбора. Мы отобрали схожую по названию и смыслу литературу в надежде предоставить читателям больше вариантов отыскать новые, интересные, ещё непрочитанные произведения.


Обсуждение, отзывы о книге «Applied Modeling Techniques and Data Analysis 2» и просто собственные мнения читателей. Оставьте ваши комментарии, напишите, что Вы думаете о произведении, его смысле или главных героях. Укажите что конкретно понравилось, а что нет, и почему Вы так считаете.