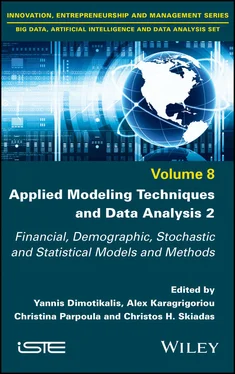
Applied Modeling Techniques and Data Analysis 2
Здесь есть возможность читать онлайн «Applied Modeling Techniques and Data Analysis 2» — ознакомительный отрывок электронной книги совершенно бесплатно, а после прочтения отрывка купить полную версию. В некоторых случаях можно слушать аудио, скачать через торрент в формате fb2 и присутствует краткое содержание. Жанр: unrecognised, на английском языке. Описание произведения, (предисловие) а так же отзывы посетителей доступны на портале библиотеки ЛибКат.
- Название:Applied Modeling Techniques and Data Analysis 2
- Автор:
- Жанр:
- Год:неизвестен
- ISBN:нет данных
- Рейтинг книги:5 / 5. Голосов: 1
-
Избранное:Добавить в избранное
- Отзывы:
-
Ваша оценка:
- 100
- 1
- 2
- 3
- 4
- 5
Applied Modeling Techniques and Data Analysis 2: краткое содержание, описание и аннотация
Предлагаем к чтению аннотацию, описание, краткое содержание или предисловие (зависит от того, что написал сам автор книги «Applied Modeling Techniques and Data Analysis 2»). Если вы не нашли необходимую информацию о книге — напишите в комментариях, мы постараемся отыскать её.
Applied Modeling Techniques and Data Analysis 2 — читать онлайн ознакомительный отрывок
Ниже представлен текст книги, разбитый по страницам. Система сохранения места последней прочитанной страницы, позволяет с удобством читать онлайн бесплатно книгу «Applied Modeling Techniques and Data Analysis 2», без необходимости каждый раз заново искать на чём Вы остановились. Поставьте закладку, и сможете в любой момент перейти на страницу, на которой закончили чтение.
Интервал:
Закладка:
2 Chapter 3 Figure 3.1. Form of EV(x,b) as function of b for fixed x. For a color version o...Figure 3.2. Simulation of the process Yt and dividends Vt(χ,b). For a color ver...Figure 3.3. Surplus and dividends under barrier strategy. For a color version o...Figure 3.4. Surplus and dividends under threshold strategy For a color version ...
3 Chapter 4Figure 4.1. Projection of the demographic ratio of CMR Figure 4.2. Evolution of wage trajectory by age. For a color version of this fi...Figure 4.3. Projection Of contribution rates and replacement rate in DB. For a ...Figure 4.4. Projection Of contribution rates and replacement rate under the Mus...Figure 4.5. Projection of the reserve fund Without adjustment Figure 4.6. Projection of the reserve fund with adjustment
4 Chapter 5Figure 5.1. Exchange rate data. Note that SEK/RWF (× 10) and KES/RWF(× 100). Fo...Figure 5.2. Logarithmic returns. For a color version of this figure, see www.is...Figure 5.3. Rolling volatility. For a color version of this figure, see www.ist...Figure 5.4. One-week volatility forecasts with λ = 0 .97. For a color version of...Figure 5.5. One-month volatility forecasts with λ = 0 .97. For a color version o...Figure 5.6. One-quarter volatility forecasts with λ = 0 .97. For a color version...
5 Chapter 7Figure 7.1. Life expectancy (LE) and healthy life expectancy (HLE) in Sweden, f...Figure 7.2. Healthy life years lost (HLYL) in Sweden, females (1751-2016) Figure 7.3. Logistic model fit and forecasts to 2060 for females in Sweden. For...
6 Chapter 8Figure 8.1. Participation of respondents from the Health Centers and Local Heal...Figure 8.2. Self-reported frequency of influenza vaccinations 2017-2020. For a ...Figure 8.3. % frequency and 95% CI of influenza vaccination among staff
7 Chapter 9Figure 9.1. COVID-19 pandemic timeline. For a color version of this figure, see ...Figure 9.2. European national lockdown timeline. For a color version of this fi...Figure 9.3. European regional and partial lockdown timeline. For a color versio...Figure 9.4a. Total cases per 100,000 population with low prevalence. For a colo...Figure 9.4b. Total cases per 100,000 population with medium prevalence. For a c...Figure 9.4c. Total cases per 100,000 population with a high prevalence. For a c...Figure 9.5. Tests and cases per 100,000 persons. For a color version of this fi...Figure 9.6. Cases per 1,000 tests. For a color version of this figure, see www....Figure 9.7. Deaths per 100,000 cases. For a color version of this figure, see w...
8 Chapter 10Figure 10.1. DFD clustermeans structure . α = (5 ,13 ,5) T . Left: τ = 15 , right: τ ...Figure 10.2. DFD cluster means with α = (5 ,5 ,5) T and τ = 10 . Left: p 11 = p 22 = ...Figure 10.3. Ternary diagrams with isodensity contour plot of the true density ...
9 Chapter 11Figure 11.1. Comparison of Γ[ -∞,u ] and  for the gamma process. For a colorvers...Figure 11.2. Comparison of Γ[ -∞,w ] and
  for the Cauchy process. For a color ve...
10 Chapter 12Figure 12.1. Clockwise from top-left panel: ternary plots at baseline (i) and i...Figure 12.2. Logarithm of CPO values for the DirReg (left panels) and FDReg (ri...Figure 12.3. Top-left panel: ternary plot of one simulated sample from simulati...Figure 12.4. Top-left panel: ternary plot of one simulated sample from simulati...
11 Chapter 16Figure 16.1. Visual histogram comparison is difficult. For a color version of t...Figure 16.2. Deterministic evolution of the transition parameter. For a colorve...Figure 16.3. Transition for the deterministic model. For a color version of thi...Figure 16.4. Probability distribution of the transition parameter. For a color ...Figure 16.5. Transitions for companies Alcola Inc. (AA), Bank of America Corpor...
List of Tables
1 Chapter 1 Table 1.1. Tax claim, interesting and not interesting taxpayers Table 1.2. Number of coercive procedures per tax claim interval Table 1.3. Predicted values versus actual coercive procedures Table 1.4. Predicted coercive procedures versus actual interesting taxpayers Table 1.5. The most significant results of the models
2 Chapter 4Table 4.1. Distribution of the workforce between the categories Table 4.2. Replacementrates and ratio between benefits and contributions Table 4.3. Replacement rates and contribution ratio in the newsystem
3 Chapter 5Table 5.1. Descriptive statistics of raw data Table 5.2. Descriptive statistics of logarithmic returns Table 5.3. Errors (RMSE and MAPE) for different decay factors λi and out-of-sam...
4 Chapter 7Table 7.1. Logistic model parameters and estimates Table 7.2. HALE and healthy life expectancy direct estimates and logistic fit
5 Chapter 8Table 8.1. Age and gender distribution in terms of HC/LHU inside/outside the ci...Table 8.2. Professional characteristics regarding HC/LHU inside/outside the cit...Table 8.3. % frequency and 95% CI of vaccinations in total and by gender, age o...Table 8.4. Frequency of vaccinations and 95% CI between HC/LHU inside/outside t...Table 8.5. Breakdown by type of staff of impulses and preventions of vaccinatio...
6 Chapter 9Table 9.1. COVID-19 suspected case criteria (adapted from the WHO: https://www....
7 Chapter 10Table 10.1. Mean Vectors stratified by cluster. μkj refers to the j-th element ...Table 10.2. Mean of 500 initializations of ( α , τ ) in different parameter config...Table 10.3. Parameter configurations for all the DFD simulations Table 10.4. Results for the simulation study regarding the initialization proce...Table 10.5. ID4- Simulation results
8 Chapter 12Table 12.1. Posterior means and CIs of unknown parameters together with WAIC ba...Table 12.2. Posterior means and CIs of unknown parameters together with WAIC ba... Table 12.3. Posterior means and CIs of unknown parameters together with WAIC ba... Table 12.4. Posterior means and CIs of unknown parameters together with WAIC ba... Table 12.5. Simulation study2: posterior means and CIs of unknown parameters to...Table 12.6. Simulation study 3: posterior means and CIs of unknown parameters t...
9 Chapter 14Table 14.1. For different points on a three-dimensional sphere and the square o...Table 14.2. Comparison of the value of the Vandermonde determinant (∣X∣) and th...
10 Chapter 15Table 15.1. Evaluation of the Pi’s of the weighted predictor for the models M1,...Table 15.2. Skewness-adjusted (Grabowski et al. 2020) PI’s of Li (2011) and Sta...
Guide
1 Cover
2 Table of Contents
3 Title Page Big Data, Artificial Intelligence and Data Analysis Set coordinated by Jacques Janssen Volume 8
4 Copyright First published 2021 in Great Britain and the United States by ISTE Ltd and John Wiley & Sons, Inc. Apart from any fair dealing for the purposes of research or private study, or criticism or review, as permitted under the Copyright, Designs and Patents Act 1988, this publication may only be reproduced, stored or transmitted, in any form or by any means, with the prior permission in writing of the publishers, or in the case of reprographic reproduction in accordance with the terms and licenses issued by the CLA. Enquiries concerning reproduction outside these terms should be sent to the publishers at the undermentioned address: ISTE Ltd 27-37 St George’s Road London SW19 4EU UK www.iste.co.uk John Wiley & Sons, Inc. 111 River Street Hoboken, NJ 07030 USA www.wiley.com © ISTE Ltd 2021 The rights of Yannis Dimotikalis, Alex Karagrigoriou, Christina Parpoula and Christos H. Skiadas to be identified as the authors of this work have been asserted by them in accordance with the Copyright, Designs and Patents Act 1988. Library of Congress Control Number: 2020951002 British Library Cataloguing-in-Publication Data A CIP record for this book is available from the British Library ISBN 978-1-78630-674-6
Интервал:
Закладка:
Похожие книги на «Applied Modeling Techniques and Data Analysis 2»
Представляем Вашему вниманию похожие книги на «Applied Modeling Techniques and Data Analysis 2» списком для выбора. Мы отобрали схожую по названию и смыслу литературу в надежде предоставить читателям больше вариантов отыскать новые, интересные, ещё непрочитанные произведения.
Обсуждение, отзывы о книге «Applied Modeling Techniques and Data Analysis 2» и просто собственные мнения читателей. Оставьте ваши комментарии, напишите, что Вы думаете о произведении, его смысле или главных героях. Укажите что конкретно понравилось, а что нет, и почему Вы так считаете.


