Applied Modeling Techniques and Data Analysis 2
Здесь есть возможность читать онлайн «Applied Modeling Techniques and Data Analysis 2» — ознакомительный отрывок электронной книги совершенно бесплатно, а после прочтения отрывка купить полную версию. В некоторых случаях можно слушать аудио, скачать через торрент в формате fb2 и присутствует краткое содержание. Жанр: unrecognised, на английском языке. Описание произведения, (предисловие) а так же отзывы посетителей доступны на портале библиотеки ЛибКат.
- Название:Applied Modeling Techniques and Data Analysis 2
- Автор:
- Жанр:
- Год:неизвестен
- ISBN:нет данных
- Рейтинг книги:5 / 5. Голосов: 1
-
Избранное:Добавить в избранное
- Отзывы:
-
Ваша оценка:
Applied Modeling Techniques and Data Analysis 2: краткое содержание, описание и аннотация
Предлагаем к чтению аннотацию, описание, краткое содержание или предисловие (зависит от того, что написал сам автор книги «Applied Modeling Techniques and Data Analysis 2»). Если вы не нашли необходимую информацию о книге — напишите в комментариях, мы постараемся отыскать её.
Applied Modeling Techniques and Data Analysis 2 — читать онлайн ознакомительный отрывок
Ниже представлен текст книги, разбитый по страницам. Система сохранения места последней прочитанной страницы, позволяет с удобством читать онлайн бесплатно книгу «Applied Modeling Techniques and Data Analysis 2», без необходимости каждый раз заново искать на чём Вы остановились. Поставьте закладку, и сможете в любой момент перейти на страницу, на которой закончили чтение.
Интервал:
Закладка:
The key feature of our procedure is the twofold selection process target, needed to maximize the IRA’s audit processes’ effectiveness. The methodology we suggest will soon be validated in real cases i.e. a sample of taxpayers will be selected according to the classification criteria developed in this chapter and will be subsequently involved in some audit processes.
1.2. Materials and methods
1.2.1. Data
Data on hand refers to a sample of 8,028 audited self-employed individuals for fiscal year 2012, each described by a set of features, concerning, among others, their tax returns, their properties and their tax notice. 3
Just for descriptive purposes, we can depict the statistical distribution of the revenues achieved by the businesses in our sample, grouped in classes (in thousands of euros), in Figure 1.1.
Most of our dataset is made up of small-sized taxpayers, of which almost 50% show revenues lower than € 75,000 per year and only 4% higher than € 500,000, with a sample average of € 146,348.
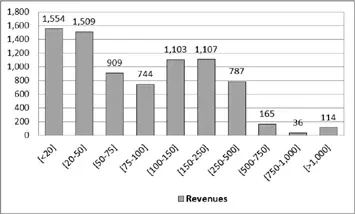
Figure 1.1. Revenues distribution
For each taxpayer in the dataset, both his tax notice status and the additional due taxes (i.e. the additional requested tax amount) are known.
Here comes the first problem that needs to be tackled: the additional due tax is a numeric attribute which measures the seriousness of the taxpayer’s tax evasion, whereas our algorithms, as we will show later on, need categorical values in order to predict. Thus, we cannot directly use the additional due taxes, but we need to define a class variable and decide both which values it will take and how to map each numeric value referred to the additional due taxes into such categorical values.
1.2.2. Interesting taxpayers
We must define a function f(x) which associates, to each element x in the dataset, a categorical value that shows its fraud risk degree and represents the class our first model will try to predict. Of course, a function that labels all the taxpayers in the dataset as tax evaders would be useless. Thus, a distinction needs to be drawn between serious tax evasion cases and those that are less relevant. To this purpose, we somehow follow (Basta et al . 2009) and choose to divide the taxpayers into two groups, the interesting ones and the not interesting ones, from the tax administration point of view (to a certain extent, interesting stands for “ it might be interesting for the tax administration to go and check what’s going on .. .”), based on two criteria: profitability (i.e. the ability to identify the most serious cases of tax evasion, independently from all other factors) and fairness (i.e. the ability to identify the most serious cases of tax evasion, with respect to the taxpayer’s turnover).
Honest taxpayers are treated as not interesting taxpayers, even though this label is used to indicate moderate tax evasion cases. We are somehow forced to use this approximation since we only have data on taxpayers who received a tax notice, and not on taxpayers for which an audit process may have been closed without qualifications, or may have not even been started.
Therefore, in order to take the profitability issue into account, we define a new variable, called the tax claim , which represents the higher assessed taxes if the tax notice stage is still open , or the higher settled taxes if the stage status is definitive . Note that the higher assessed tax could be different from the higher settled tax, because the IRA and the taxpayer, while reaching an agreement, can both reconsider their positions. The tax claim distribution grouped in classes (again, in thousands of euros) is shown in Figure 1.2.
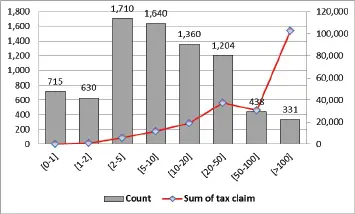
Figure 1.2. Tax claim distribution. For a color version of this figure, see www.iste.co.uk/dimotikalis/analysis2.zip
The left vertical axis is related to the tax claim distribution, grouped in the classes shown on the horizontal axis; the right vertical axis, on the contrary, sums up the monetary tax claim amount that arises from each group (in thousands of euro). Therefore, as it can easily be seen, the 331 most profitable tax notices (12% of the total) account for almost half of the tax revenue arising from our dataset.
The fairness criterion is then introduced to address the audit process, even towards smaller firms (which usually are charged smaller amounts of due income taxes), and it is useful as it allows the tax authorities to not discriminate against taxpayers on the basis of their turnover and introduces a deterrent effect which improves the overall tax compliance .
Therefore, we define another variable, called Z, which takes into account, for each taxpayer, both his turnover and revenues, and compares them to the tax claim . More formally, both of the ratios  and
and  are computed. Then, the minimum between these two ratios and 1 is taken. That is, the variable Z value, which thus ranges from 0 to 1.
Now, for both tax claim (TC) and Z, we calculate the 25th percentile (Q1) , the median value ( Q 2) and the 75th percentile ( Q 3). We then state that a taxpayer may be considered interesting if he satisfies one of the following conditions:
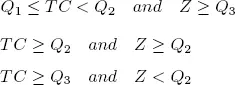
The three above-mentioned rules can be represented as in Figure 1.3.
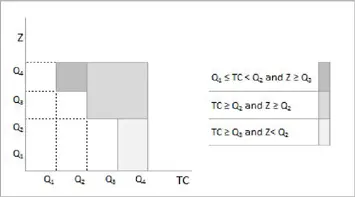
Figure 1.3. Determining interesting and not interesting taxpayers. For a color version of this figure, see www.iste.co.uk/dimotikalis/analysis2.zip
Once the population of our dataset is entirely divided into interesting and not interesting taxpayers, we can see from Table 1.1that the interesting ones are far more profitable than the others ( tax claim values are in thousands of euros). A machine learning tool able to distinguish these two kinds of taxpayers fairly well would then be very useful.
Our first model task will then be that of identifying, with a certain confidence degree, the taxpayers who are more likely to have evaded (both in absolute terms and as a percentage of revenues or turnover).
The literature on tax fraud detection, although using different methods and algorithms, is usually only concerned about this issue, i.e. in finding the best way to identify the most relevant cases of tax evasion (Bonchi et al . 1999; Wu et al . 2012; Gonzalez and J.D. Velasquez 2013; de Roux et al . 2018).
There is another crucial issue that has to be taken into account, i.e. the effective tax authorities’ ability to collect the tax debt arising from the tax notices sent to all of the unfaithful taxpayers. Table 1.1. Tax claim, interesting and not interesting taxpayers
Читать дальшеИнтервал:
Закладка:
Похожие книги на «Applied Modeling Techniques and Data Analysis 2»
Представляем Вашему вниманию похожие книги на «Applied Modeling Techniques and Data Analysis 2» списком для выбора. Мы отобрали схожую по названию и смыслу литературу в надежде предоставить читателям больше вариантов отыскать новые, интересные, ещё непрочитанные произведения.


Обсуждение, отзывы о книге «Applied Modeling Techniques and Data Analysis 2» и просто собственные мнения читателей. Оставьте ваши комментарии, напишите, что Вы думаете о произведении, его смысле или главных героях. Укажите что конкретно понравилось, а что нет, и почему Вы так считаете.