7 Chapter 11Table 11.1 Distinctions between non‐parametric and parametric tests.
8 Chapter 12Table 12.1 Frequency of patient deaths.Table 12.2 Head injuries and helmets.Table 12.3 Numbers of women smokers and non‐smokers.Table 12.4 Calculation of expected frequencies.Table 12.5 Depression and suicidal intent (expected frequencies in brackets).Table 12.6 Gender differences in locations of accidents (expected frequencies...
9 Chapter 13Table 13.1 The strength of a correlation.Table 13.2 Chest circumference and birth weight of 10 babies.Table 13.3 Attendance at births by trained care workers in different countrie...
10 Chapter 15Table 15.1 Waiting times (min) at four outpatient clinics (rank score in brac...Table 15.2 Time taken by 15 student subjects (A–O) to undertake a task before...Table 15.3 Ranking of matched pairs.Table 15.4 Growth weights (kg) of matched pairs of babies.
11 Chapter 16Table 16.1 Systolic blood pressure measurements from four hospital wards.Table 16.2 Mean (with S.E.) systolic blood pressure measurements (mmHg) of sa...
12 Appendix LTable L.1 Values of Q to be used in the formula for calculating the required ...
1 Chapter 3 Figure 3.1 The limits of an observation.
2 Chapter 4Figure 4.1 Dot plots showing frequency distribution of (a) 17 new‐born baby ...Figure 4.2 Bar graph showing distribution of blood‐group types.Figure 4.3 Frequency distribution of traffic accident fatalities.Figure 4.4 Frequency distribution of systolic blood pressure observations fr...Figure 4.5 Frequency polygon of systolic blood pressure observations from 15...Figure 4.6 Frequency curve of 100 new‐born baby weights.Figure 4.7 Boys weight‐for‐age growth chart from birth to 12 months.Figure 4.8 Scattergram of weight and chest circumference of 25 new‐born babi...Figure 4.9 Location of accidents (a) males and (b) females.
3 Chapter 6Figure 6.1 The principle of cohort studies.Figure 6.2 Principle of case‐control studies.
4 Chapter 7Figure 7.1 Bimodal distribution of Forced Expiratory Volume in one second of...Figure 7.2 (a) Symmetrical distribution; (b) skewed distribution.
5 Chapter 9Figure 9.1 Estimated probability distribution of new‐born baby weights.Figure 9.2 Gradation of histogram (a) into the normal curve (b).Figure 9.3 Normal curves. (a) Similar μ and different σ; (b) different μ and...Figure 9.4 Normal curve with standard deviations.Figure 9.5 The normal curve with 5% in two tails.Figure 9.6 The normal curve with 5% in upper tail.Figure 9.7 (a) Untransformed observations; (b) logarithmically transformed o...
6 Chapter 10Figure 10.1 The difference between two sample means.
7 Chapter 11Figure 11.1 Size frequency distributions of systolic blood pressure measurem...Figure 11.2 Hypothesis testing and the normal curve. (a) Two‐tailed test; (b...
8 Chapter 13Figure 13.1 Scattergrams of bivariate data.Figure 13.2 Perfect correlations.
9 Chapter 14Figure 14.1 A regression line.Figure 14.2 Gradients of slopes: gradient = y units/ x units.Figure 14.3 Final height of car above sea level = a + bx , where b is the gra...Figure 14.4 A perfect linear relationship.Figure 14.5 Deviations from the regression line.Figure 14.6 Regression of oxygen consumption on exercise time.Figure 14.7 Graph of decline in plasma concentration of ‘Drug D’. (a) Axes u...
1 Cover Page
2 Title Page
3 Copyright Page
4 Preface
5 Foreword to Students
6 Table of Contents
7 Begin Reading
8 Appendix A Table of Random Numbers
9 Appendix B t‐Distribution
10 Appendix C χ 2‐Distribution
11 Appendix D Critical Values of Spearman's Rank Correlation Coefficient
12 Appendix E Critical Values of the Product Moment Correlation Coefficient
13 Appendix F Mann–Whitney U ‐test Values (Two‐Tailed Test) P = 0.05
14 Appendix G Critical Values of T in the Wilcoxon Test for Matched Pairs
15 Appendix H F‐Distribution
16 Appendix I Tukey Test
17 Appendix J Symbols
18 Appendix K Leicestershire ECT Study Data:
19 Appendix L How Large Should Our Samples Be?
20 Bibliography
21 Index
22 Wiley End User License Agreement
1 iii
2 iv
3 xi
4 xii
5 xiii
6 xiv
7 xv
8 1
9 2
10 3
11 5
12 6
13 7
14 8
15 9
16 10
17 11
18 12
19 13
20 14
21 15
22 16
23 17
24 18
25 19
26 20
27 21
28 22
29 23
30 25
31 26
32 27
33 28
34 29
35 30
36 31
37 32
38 33
39 34
40 35
41 36
42 37
43 38
44 39
45 40
46 41
47 42
48 43
49 44
50 45
51 46
52 47
53 48
54 49
55 50
56 51
57 52
58 53
59 54
60 55
61 57
62 58
63 59
64 60
65 61
66 62
67 63
68 65
69 66
70 67
71 68
72 69
73 70
74 71
75 72
76 73
77 74
78 75
79 76
80 77
81 78
82 79
83 81
84 82
85 83
86 84
87 85
88 86
89 87
90 88
91 89
92 90
93 91
94 92
95 93
96 94
97 95
98 96
99 97
100 99
101 100
102 101
103 102
104 103
105 104
106 105
107 106
108 107
109 108
110 109
111 110
112 111
113 113
114 114
115 115
116 116
117 117
118 118
119 119
120 120
121 121
122 122
123 123
124 124
125 125
126 126
127 127
128 128
129 129
130 130
131 131
132 132
133 133
134 135
135 136
136 137
137 138
138 139
139 140
140 141
141 142
142 143
143 144
144 145
145 146
146 147
147 148
148 149
149 150
150 151
151 152
152 153
153 154
154 155
155 156
156 157
157 159
158 160
159 161
160 162
161 163
162 164
163 165
164 166
165 167
166 169
167 170
168 171
169 173
170 174
171 175
172 176
173 177
174 178
175 179
176 180
177 181
178 183
179 184
180 185
181 186
182 187
183 188
184 189
185 190
186 191
187 193
188 194
189 195
190 196
191 197
192 198
193 199
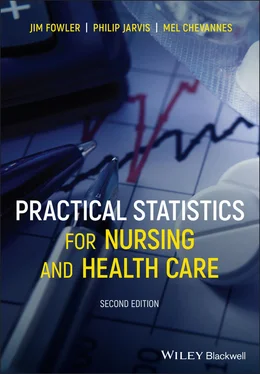
Practical Statistics for Nursing and Health Care
Second Edition
Jim Fowler
Former Principal Lecturer , Department of Biological Sciences, De Montfort University, Leicester, UK
Philip Jarvis
Statistician , Novartis Pharma AG, Basel, Switzerland
and
Mel Chevannes
Professor of Nursing and Head of Department of Nursing , De Montfort University, Leicester, UK

This second edition first published 2021
© 2021 John Wiley & Sons Ltd
Edition History John Wiley & Sons Ltd. (1e, 2002)
All rights reserved. No part of this publication may be reproduced, stored in a retrieval system, or transmitted, in any form or by any means, electronic, mechanical, photocopying, recording or otherwise, except as permitted by law. Advice on how to obtain permission to reuse material from this title is available at http://www.wiley.com/go/permissions.
Читать дальше
