Jelke Bethlehem - Handbook of Web Surveys
Здесь есть возможность читать онлайн «Jelke Bethlehem - Handbook of Web Surveys» — ознакомительный отрывок электронной книги совершенно бесплатно, а после прочтения отрывка купить полную версию. В некоторых случаях можно слушать аудио, скачать через торрент в формате fb2 и присутствует краткое содержание. Жанр: unrecognised, на английском языке. Описание произведения, (предисловие) а так же отзывы посетителей доступны на портале библиотеки ЛибКат.

- Название:Handbook of Web Surveys
- Автор:
- Жанр:
- Год:неизвестен
- ISBN:нет данных
- Рейтинг книги:5 / 5. Голосов: 1
-
Избранное:Добавить в избранное
- Отзывы:
-
Ваша оценка:
Handbook of Web Surveys: краткое содержание, описание и аннотация
Предлагаем к чтению аннотацию, описание, краткое содержание или предисловие (зависит от того, что написал сам автор книги «Handbook of Web Surveys»). Если вы не нашли необходимую информацию о книге — напишите в комментариях, мы постараемся отыскать её.
offers a practical and comprehensive guide for creating and conducting effective web surveys. The authors noted experts on the topic, include a review the Blaise system (which has been around for 30 years) and provide information on the most recent developments and techniques in the field. The book illustrates the steps needed to develop effective web surveys and explains how the survey process should be carried out. It also examines the aspects of sampling and presents a number of sampling designs.
The book includes ideas for overcoming possible errors in measurement and nonresponse. The authors also compare the various methods of data collection (face-to-face, telephone, mail, and mobile surveys) and discuss their advantages and disadvantages. Critical information for designing questionnaires for mobile devices is also provided. Filled with real-world examples,
discuss the key concepts, methods, and techniques of effective web surveys. This important book:
Contains the most recent sampling designs and estimation procedures Offers ideas for overcoming errors in web surveys Includes information on mixed mode surveys Explores the concept of response probabilities Reviews all aspects of web panels Written for researchers in government, business, economics, and social scientists, the second edition of
provides an introduction to web surveys and the various methods and techniques.
Handbook of Web Surveys — читать онлайн ознакомительный отрывок
Ниже представлен текст книги, разбитый по страницам. Система сохранения места последней прочитанной страницы, позволяет с удобством читать онлайн бесплатно книгу «Handbook of Web Surveys», без необходимости каждый раз заново искать на чём Вы остановились. Поставьте закладку, и сможете в любой момент перейти на страницу, на которой закончили чтение.
Интервал:
Закладка:
Since this program was used by subject‐matter specialists, only question names are shown on the screen shown in Figure 1.8. Additional information could be displayed through special keys. Note that the input fields for the questions Age and MarStat contain error counters. These error indicators appeared because the answers of the questions Age (2) and MarStat ( Married ) did not pass the check.
After Blaise had been in use for a while, it was realized that such a system could be made much more powerful. The questionnaire specification in the Blaise system contained all knowledge about the questionnaire and the data needed for survey processing. Therefore, Blaise should be capable to handle CAI.
Implementing CAI means that the paper questionnaire is replaced by a computer program containing the questions to be asked. The computer takes control of the interviewing process. It performs two important activities:
Route control. The computer program determines which question is to be asked next and displays that question on the screen. Such a decision may depend on the answers to previous questions. As a result, it is not possible anymore to make route errors.
Error checking. The computer program checks the answers as data are entered. Range checks are carried out immediately, as well as consistency checks after entry of all relevant answers. If an error is detected, the program produces an error message, and data must be corrected.
Use of computer‐assisted data collection has three major advantages. First, it simplifies the work of interviewer (for example, no more route control). Second, it improves the quality of the collected data. Third, data are entered in the computer during the interview resulting in a complete and clean record.
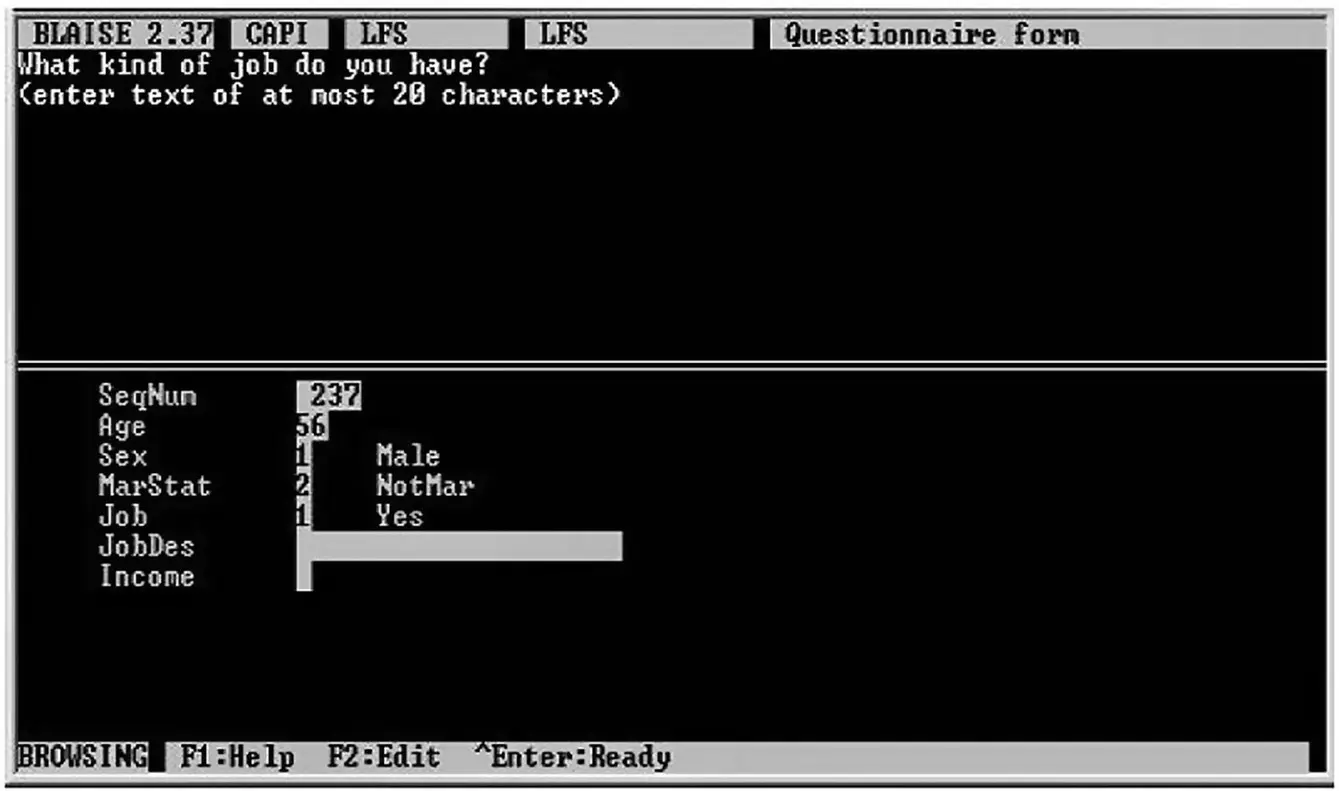
Figure 1.9 A Blaise CAPI program
Version 2 of Blaise was completed in 1988. It implemented CAPI. This is a form of face‐to‐face interviewing in which interviewers use a laptop computer to conduct the interview.
Figure 1.9shows an example of a screen of a CAPI program generated by Blaise. The screen was divided in two parts. The upper part contains the current question to be answered ( What kind of a job do you have? ). After an answer had been entered, this question was replaced by the next question on the route.
Just displaying one question at the time gave the interviewers only limited feedback on where they are in the questionnaire. Therefore, the lower part of the screen displayed (in a very compact way) the current page of the questionnaire.
Statistics Netherlands started full‐scale use of CAPI in regular survey in 1987. The first CAPI survey was the Labor Force Survey. Each month, about 400 interviewers equipped with laptops visited 12,000 addresses. After a day of interviewing, the laptop was connected to a telephone modem. The data were transmitted to the office at night. In return, new addresses were sent to the interviewers. The next morning the laptop was prepared for a new day of interviewing.
CATI was introduced in 1990 on desktop computers. Interviewers called respondents from a central unit (call center) and conducted interviews by telephone. The interviewing program for CATI was the same as that for CAPI. An important new tool for CATI was a call scheduling system. This system took care of proper delivering busy numbers (try again shortly), no answers (try again later), appointments, etc.
By the very early 1990s, nearly all household surveys of Statistics Netherlands had become CAPI or CATI surveys. Surveys using paper forms had almost become extinct. Table 1.3lists all major and regular household surveys at that time together with their mode of interviewing.
Table 1.3 Household surveys carried out by Statistics Netherlands in the early 1990s
| Survey | Mode | Interviews per year |
|---|---|---|
| Survey on Quality of Life | CAPI | 7,500 |
| Health Survey | CAPI | 6,200 |
| Day Recreation Survey | CAPI | 36,000 |
| Crime Victimisation Survey | CAPI | 8,000 |
| Labour Force Survey | CAPI | 150,000 |
| Car Use Panel | CATI | 8,500 |
| Consumer Sentiments Survey | CATI | 24,000 |
| Social‐Economic Panel | CATI | 5,500 |
| School Career Survey | CATI | 4,500 |
| Mobility Survey | CATI/CADI | 20,000 |
| Budget Survey | CADI | 2,000 |
In the middle of the 1990s, the MS‐DOS operating system on microcomputers was replaced by Windows. This marked the start of the use of graphical user interfaces. Early versions of the Internet browser Internet Explorer were included in this operating system.
Blaise 4 was the first production version of Blaise for Windows released in 1998. When more and more people and companies were connected to the Internet, web surveys became a popular mode of data collection among researchers. The main reasons of this popularity were the high response speed, the possibility to provide feedback to respondents about the meaning of questions and possible errors, and the freedom for the respondents to choose their own moment to fill in the questionnaire.
The graphical user interface offered many more possibilities for screen layout. Figure 1.10gives an example of a screen of the Blaise 4 CAPI program.
Since respondents are familiar with browsers from all their other activities on the Internet, there was no need to explain the graphical user interface.
The possibility to conduct web surveys was included in version 4.6 of Blaise released in 2003. The respondent completes the questionnaire online allowing continuous interaction between the computer of the respondent and the software on the Internet server.
The Internet questionnaire is divided into pages. Each page may contain one or more questions. After the respondent has answered all questions on a page, the answers are submitted to the Internet server. The answers are checked; a new page is returned to the respondent. The contents of this page may depend on the answers to previous questions.
Figures 1.11and 1.12show an example of the same page of a web survey when using Blaise 5. In this case, the page contains only one question. The first page will be displayed when using a tablet, and the second page will be displayed when using a smartphone.
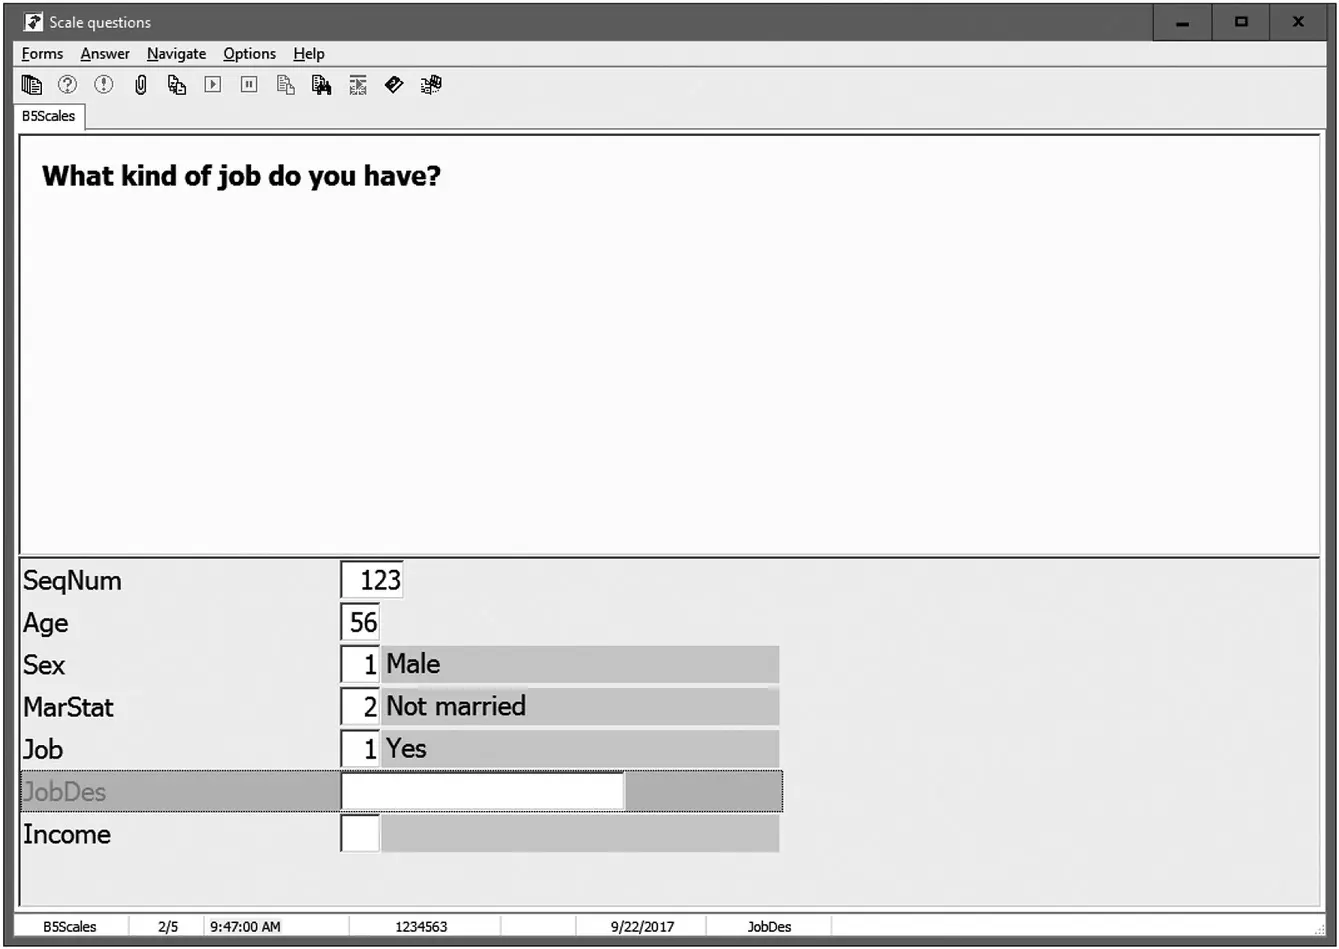
Figure 1.10 The screen of a CAPI program in Blaise 4
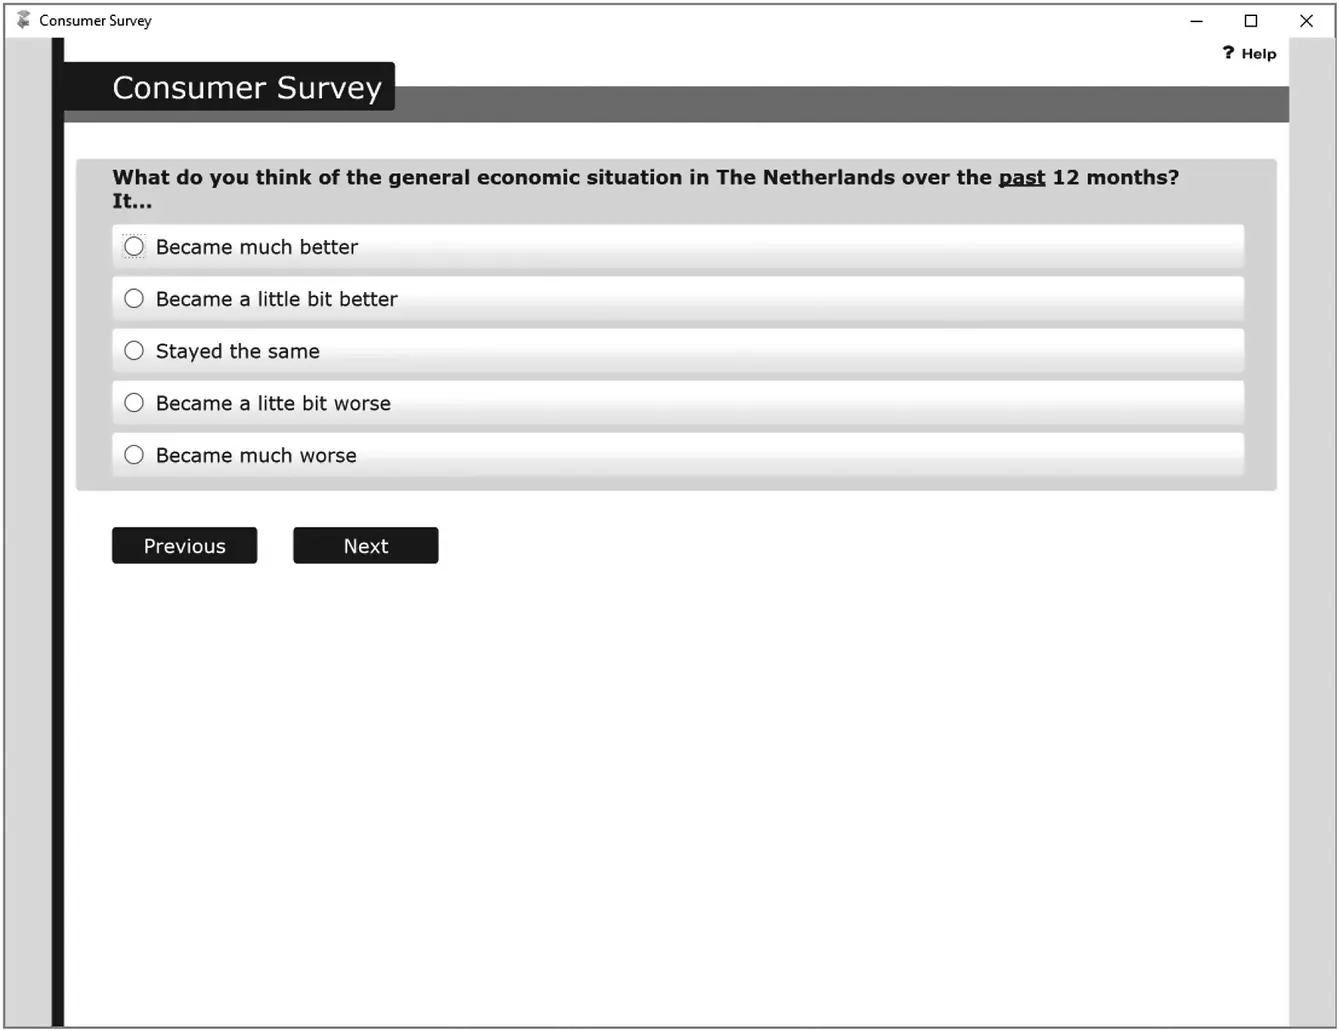
Figure 1.11 The screen of a Blaise 5 web survey on a tablet
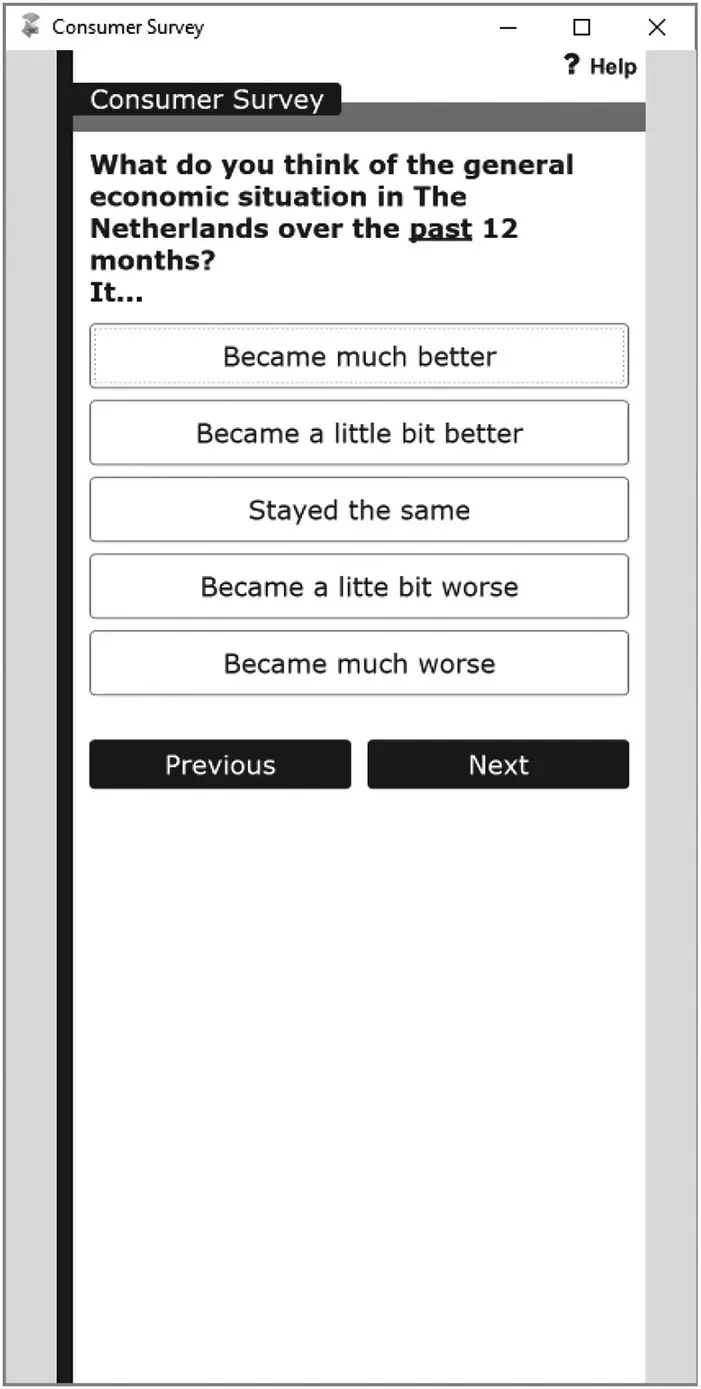
Figure 1.12 The screen of a Blaise 5 web survey on a smartphone
The Blaise 5 system implements a number of source code features ( Languages, Modes, Roles, and SpecialAnswers ) that specifically address challenges listed above. It also implements a cross‐platform layout designer, templates, and cross‐platform settings that handle presentation and operability issues. Finally, Blaise 5 allows the institute to combine these features in as many ways as suits its survey program and population.
Читать дальшеИнтервал:
Закладка:
Похожие книги на «Handbook of Web Surveys»
Представляем Вашему вниманию похожие книги на «Handbook of Web Surveys» списком для выбора. Мы отобрали схожую по названию и смыслу литературу в надежде предоставить читателям больше вариантов отыскать новые, интересные, ещё непрочитанные произведения.


Обсуждение, отзывы о книге «Handbook of Web Surveys» и просто собственные мнения читателей. Оставьте ваши комментарии, напишите, что Вы думаете о произведении, его смысле или главных героях. Укажите что конкретно понравилось, а что нет, и почему Вы так считаете.