Hong Meng - Organic Electronics for Electrochromic Materials and Devices
Здесь есть возможность читать онлайн «Hong Meng - Organic Electronics for Electrochromic Materials and Devices» — ознакомительный отрывок электронной книги совершенно бесплатно, а после прочтения отрывка купить полную версию. В некоторых случаях можно слушать аудио, скачать через торрент в формате fb2 и присутствует краткое содержание. Жанр: unrecognised, на английском языке. Описание произведения, (предисловие) а так же отзывы посетителей доступны на портале библиотеки ЛибКат.
- Название:Organic Electronics for Electrochromic Materials and Devices
- Автор:
- Жанр:
- Год:неизвестен
- ISBN:нет данных
- Рейтинг книги:4 / 5. Голосов: 1
-
Избранное:Добавить в избранное
- Отзывы:
-
Ваша оценка:
Organic Electronics for Electrochromic Materials and Devices: краткое содержание, описание и аннотация
Предлагаем к чтению аннотацию, описание, краткое содержание или предисловие (зависит от того, что написал сам автор книги «Organic Electronics for Electrochromic Materials and Devices»). Если вы не нашли необходимую информацию о книге — напишите в комментариях, мы постараемся отыскать её.
Readers will also benefit from the inclusion of:
A thorough introduction to organic electrochromism, including its history and the mechanisms of electrochromic devices An exploration of polymer electrolytes for electrochromic applications, including their requirements and types A discussion of electrochromic small molecules, including the development of technology in conjugated polymer and violene-cyanine hybrids A treatment of Prussian blue and metallohexacyanates, including their backgrounds, technology development, crystal structures, synthesis, nanocomposites, and assembled electrochromic devices Perfect for materials scientists, polymer chemists, organic chemists, physical chemists, and inorganic chemists,
will also earn a place in the libraries of physicists and those who work in the optical industry who seek a one-stop reference that covers all aspects of organic electrochromic materials.
Organic Electronics for Electrochromic Materials and Devices — читать онлайн ознакомительный отрывок
Ниже представлен текст книги, разбитый по страницам. Система сохранения места последней прочитанной страницы, позволяет с удобством читать онлайн бесплатно книгу «Organic Electronics for Electrochromic Materials and Devices», без необходимости каждый раз заново искать на чём Вы остановились. Поставьте закладку, и сможете в любой момент перейти на страницу, на которой закончили чтение.
Интервал:
Закладка:
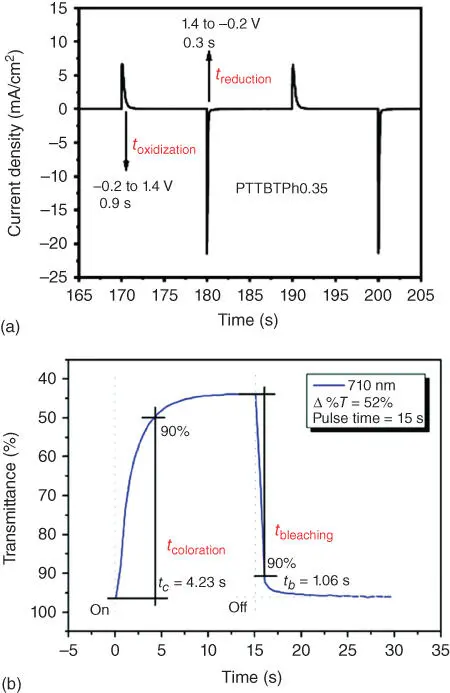
Figure 1.6 The switching time of EC materials. (a) Electrochemical switching time.
Source: Li et al. [21]. © 2018, Royal Society of Chemistry
(b) Optical switching time.
Source: Hsiao et al. [27].
However, the aforementioned method of switching time is an experiential measurement, which has a difference in varied research groups, such as the different percentage of transmittance change (90% or 95%). Therefore, it is difficult to compare switching time data between different research groups. In recent years, Javier Padilla and coworkers proposed a standard method for calculating EC switching times. They fitted the contrast values as a function of pulse length to the following exponential increase function:
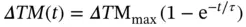
where Δ T maxrepresents the full‐switch contrast obtained for long pulse lengths and τ is the time constant. If switching time t is equal to τ , 63.2% of the maximum transmittance change is reached. At a time of 2.3 τ , 90% ΔTM maxis switched, identically 95% and 99% of ΔTM maxcorresponding to 3 τ and 4.6 τ .
Therefore, for new EC materials, the same chronoabsorptometric responses [28] should be measured and fitted to the aforementioned function. From the fittings, the max values of ΔTM max(the contrast corresponding to a full switch), the time constant τ , and the corresponding regression coefficient r 2will be obtained. Afterwards the switching time t 90%or t 95%will be easily calculated. This method allows an easy direct comparison between different reported values.
1.3.3 Coloration Efficiency
Coloration efficiency (CE) plays a fundamental role in the evaluation of the efficiency of charge utilization during the EC processes. It relates the optical absorbance change of an EC material at a given wavelength (Δ A ) to the density of injected/ejected electrochemical charge necessary to induce a full switch ( Q d). The higher CE value indicates a large transmittance change with a small amount of charge, which makes more effective use of the injected charge. CE value can be calculated using the following equation:
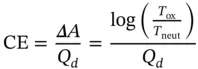
where T oxand T neutare the transmittances in the oxidized and neutral states, respectively, and Q drepresents the injected/ejected charge per unit area, which could be obtained from the integral area of the current density curve during voltage switching ( Figure 1.7).
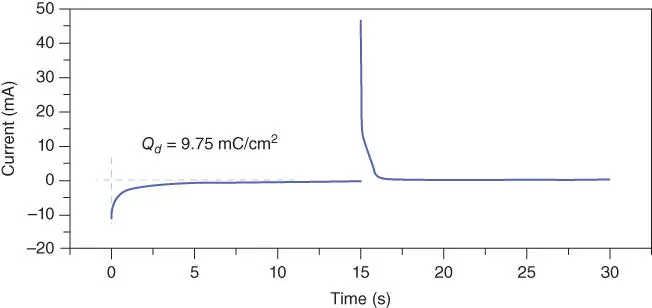
Figure 1.7 The calculation of Q d.
Source: Hsiao et al. [27].
Very similar to the previous parameters contrast and switching time, the CE values are also different depending on the selective wavelength, as shown in Figure 1.8. Several kinds of CE value of the same EC materials are exhibited: in most reported literature, the CE of characteristic wavelength reaching the maximum contrast ( λ max) is calculated, which is the maximum CE value (CE max). Also, the CE value at 555 nm is calculated for comparison in different publishes because of the highest sensitivity of human eyes at 555 nm as well as the photopic CE based on the photopic transmittance mentioned in the contrast part, which considered the light transmission over the wavelength range between 380 and 780 nm normalized with the spectral sensitivity of the human eye. Therefore, more plot of CE values should be obtained rather than single‐valued CE values, to give more information about the performance of EC materials.
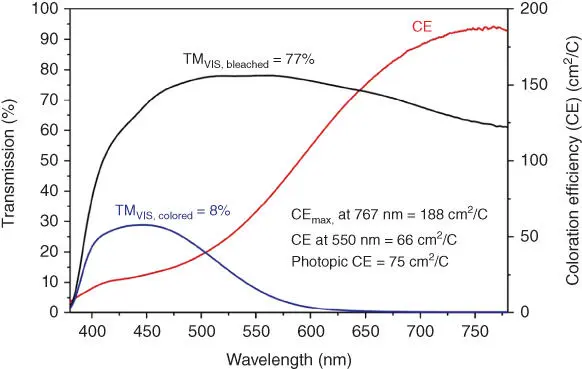
Figure 1.8 Different types of CE value of the same EC materials.
Source: Kraft [25].
In addition, when insightfully considering the injected/ejected charge Q d, we can find it in fact to consist of three part: faradaic charge Q Fassociated with doping/de‐doping, capacitive charge Q Cdue to the capacitive nature of the ECD, and parasitic charge Q Passociated with electrolyte/impurity reactions. Among them, the faradaic charge is the source of redox activity leading to chromic change actually. Therefore, Fabretto et al. reported a new technique for measuring CE by extracting the faradaic charge from the total charge and calculated the only faradaic charge‐based CE value [29]. As we discussed, the total charge flow is simply the addition of the three individual charge flows and is given by
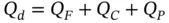
where the parasitic current was a small component (approximately <2%) compared with the other two and therefore can be ignored. Then the time–evolution total current flow can be described as following:

where n is the number of electrons transferred per molecule, F is the Faraday constant (96 500 C/mol), A is the electrode area (cm 2), C 0is the concentration of species in the bulk solution (mol/cm 3), D is the apparent diffusion coefficient (cm 2/s), t is time in seconds, I 0is the maximum current flow at t = 0, R is the cell resistance, and C is the double layer capacitance. Then fitting the experimental data to this equation and substituting the constant k , at last, a plot of the time–evolution faradaic current will be obtained, and the corresponding faradic‐corrected CEs can be calculated. Usually, the faradic‐corrected CEs are larger than the uncorrected results, because the total charge ingress/egress (i.e. Q d) is larger than the faradic charge (i.e. QF).
1.3.4 Optical Memory
The optical or EC memory (also called open‐circuit memory) of an EC material can be defined as the propensity of the material to retain its redox/colored state upon removing the external bias. Usually, the memory effect are often observed in film‐state EC materials such as conjugated polymers, which well adhered onto the electrode, and hence restrict the movement of the electrons. In contrast, some solution‐based ECDs (e.g. viologens) will exhibit a self‐erasing effect, which means the colored state disappeared rapidly in the absence of applied voltage because the electrons diffuse freely in this type of device. The memory effect is useful for the energy‐saving devices and also can be applied for data storage. Figure 1.9shows an optical memory test. The short‐term memory was investigated by applying a potential pulse for 2 seconds prior to forming the open‐circuit state for 100 seconds; the transmittance change at 423 nm was monitored simultaneously ( Figure 1.9a). Then a long‐term memory is also studied by applying a potential for two seconds and removing the bias for one hour ( Figure 1.9b). The EC conjugated polymers remain in the initial transmittance contrast well in the absence of an applied voltage, which exhibits a good optical memory.
Читать дальшеИнтервал:
Закладка:
Похожие книги на «Organic Electronics for Electrochromic Materials and Devices»
Представляем Вашему вниманию похожие книги на «Organic Electronics for Electrochromic Materials and Devices» списком для выбора. Мы отобрали схожую по названию и смыслу литературу в надежде предоставить читателям больше вариантов отыскать новые, интересные, ещё непрочитанные произведения.


Обсуждение, отзывы о книге «Organic Electronics for Electrochromic Materials and Devices» и просто собственные мнения читателей. Оставьте ваши комментарии, напишите, что Вы думаете о произведении, его смысле или главных героях. Укажите что конкретно понравилось, а что нет, и почему Вы так считаете.