Hong Meng - Organic Electronics for Electrochromic Materials and Devices
Здесь есть возможность читать онлайн «Hong Meng - Organic Electronics for Electrochromic Materials and Devices» — ознакомительный отрывок электронной книги совершенно бесплатно, а после прочтения отрывка купить полную версию. В некоторых случаях можно слушать аудио, скачать через торрент в формате fb2 и присутствует краткое содержание. Жанр: unrecognised, на английском языке. Описание произведения, (предисловие) а так же отзывы посетителей доступны на портале библиотеки ЛибКат.
- Название:Organic Electronics for Electrochromic Materials and Devices
- Автор:
- Жанр:
- Год:неизвестен
- ISBN:нет данных
- Рейтинг книги:4 / 5. Голосов: 1
-
Избранное:Добавить в избранное
- Отзывы:
-
Ваша оценка:
Organic Electronics for Electrochromic Materials and Devices: краткое содержание, описание и аннотация
Предлагаем к чтению аннотацию, описание, краткое содержание или предисловие (зависит от того, что написал сам автор книги «Organic Electronics for Electrochromic Materials and Devices»). Если вы не нашли необходимую информацию о книге — напишите в комментариях, мы постараемся отыскать её.
Readers will also benefit from the inclusion of:
A thorough introduction to organic electrochromism, including its history and the mechanisms of electrochromic devices An exploration of polymer electrolytes for electrochromic applications, including their requirements and types A discussion of electrochromic small molecules, including the development of technology in conjugated polymer and violene-cyanine hybrids A treatment of Prussian blue and metallohexacyanates, including their backgrounds, technology development, crystal structures, synthesis, nanocomposites, and assembled electrochromic devices Perfect for materials scientists, polymer chemists, organic chemists, physical chemists, and inorganic chemists,
will also earn a place in the libraries of physicists and those who work in the optical industry who seek a one-stop reference that covers all aspects of organic electrochromic materials.
Organic Electronics for Electrochromic Materials and Devices — читать онлайн ознакомительный отрывок
Ниже представлен текст книги, разбитый по страницам. Система сохранения места последней прочитанной страницы, позволяет с удобством читать онлайн бесплатно книгу «Organic Electronics for Electrochromic Materials and Devices», без необходимости каждый раз заново искать на чём Вы остановились. Поставьте закладку, и сможете в любой момент перейти на страницу, на которой закончили чтение.
Интервал:
Закладка:
More recently, with the active researches on the crystalline and porous MOFs and COFs, the sixth‐generation MOFs/COFs EC materials have emerged. In 2013, the first EC properties of MOFs using naphthalene diimide (NDI) as organic linker were reported by Professor M. Dinca's group [19]. And the first COFs EC material using the TPA as building block was revealed by Yuwu Zhong and Dong Wang and coworkers in 2019 [20]. All in all, some essential features of MOFs/COFs give them advantages in EC, including designable and precise molecular structure, simple self‐assembly synthesis, and porous structure that facilitate the electrolyte ions transport. However, these new EC materials haven't been fully revealed; many efforts should be taken to improve the device performance of MOFs/COFs‐based electrochromism.
1.3 The Key Parameters of Electrochromism
In order to elucidate the EC properties of EC materials, in situ UV–Vis–NIR spectroelectrochemistry (SEC) measurements were performed on a spectrophotometer, combining with an electrochemical workstation to apply and control the potential in the SEC cell. This SEC spectrum dynamically records the absorption change of EC materials during different applied voltage, which reflects the color change during the whole redox process. As an example, the SEC of a black‐to‐transmissive EC material is shown in Figure 1.4. Both absorbance model and transmittance model could be used to carry out the SEC measurement.
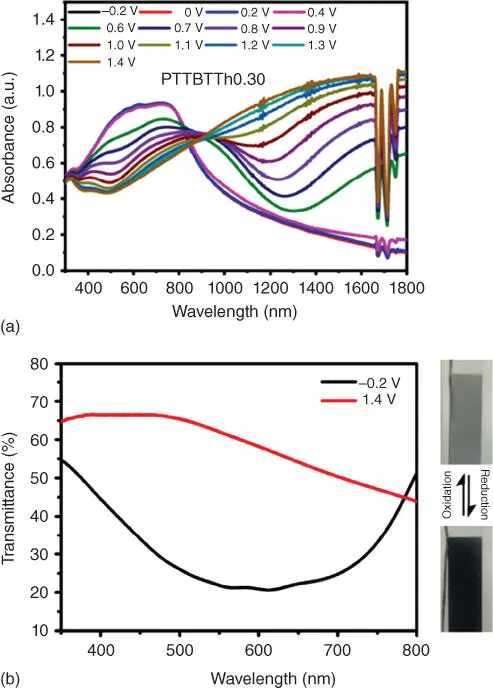
Figure 1.4 The spectroelectrochemistry (SEC) of a black‐to‐transmissive EC material. (a) Absorbance model and (b) transmittance model.
Source: Reproduced by permission Li et al. [21]. © 2018, Royal Society of Chemistry.
1.3.1 Electrochromic Contrast
EC contrast (Δ% T ) is measured as the percent transmittance change of the EC material at a specific wavelength [22] it is a primary parameter for characterizing the EC materials. It is calculated from the difference of light transmission (TM) in the bleached and colored state TM band TM cat the specified wavelength. And the transmittance values are generally recorded upon the application of square‐wave potential steps to the electroactive film placed in the beam of a spectrophotometer. Each color has a characteristic wavelength as shown in Figure 1.5b, such as the wavelength of blue color is ranging from 455 to 490 nm. Therefore, in most cases, the contrast in the characteristic wavelength is chosen to evaluate the degrees of color change. Usually the absorption of this characteristic wavelength also reaches its maximum value ( λ max). Moreover, there is evidence that human eyes are most sensitive to green light with a wavelength of 555 nm [25]. It's also recommended to calculate the contrast in 555 nm for comparison in different publications. Specifically, a contrast test example is shown in Figure 1.5a, the TM band TM cof λ max425 nm are 1% and 99%, respectively; therefore the Δ% T is calculated as 98%. For applications such as smart windows, in which the difference between the bleached and colored states is expected to be the highest, the Δ% T should be higher than 80%. Many inorganic EC materials, organic small molecules, and PEDOT series polymers, which have a high transmittance in the bleached state, can achieve this index. Especially, some reported small molecule EC materials even show Δ% T exceed 95% [23].
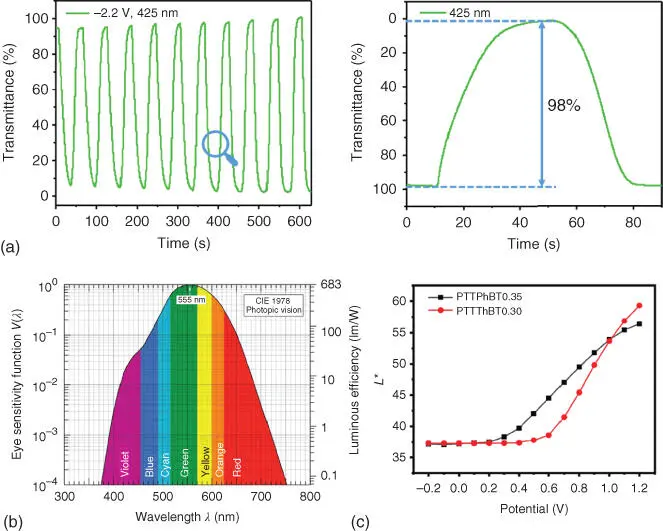
Figure 1.5 (a) The electrochromic contrast of a small molecule EC material.
Source: Jiang et al. [23]
, (b) sensitivity function of the human eye V ( λ ) and luminous efficacy vs wavelength.
Source: Fred Schubert [24]. © 2006, Cambridge University Press.
(c) The change of the lightness values from the neutral to the oxidized states.
Source: Li et al. [21]. © 2018, Royal Society of Chemistry.
Meanwhile, for some broad absorption or color‐to‐colorless EC materials, measurements on the relative luminance change (Δ% Y ) during an EC switch are more realistic for exhibiting the overall EC contrast, which conveys more information on the perception of transmittance to the human eye. As an example, a luminance change curve during the redox process of black‐to‐transmissive EC materials is shown in Figure 1.5c. The lightness L *value (from 0 (black) to 100 (white)) of 37.5 (black state) increases to 60 (bleach state); therefore the Δ% Y is calculated as 22.5%.
Except for the aforementioned method for electrochemical contrast measurements, a photopically weighted value called photopic contrast was proposed by Javier Padilla et al. [26]. The photopic contrast also reflects an overall contrast during the whole visible region, which is more consistent with the real application condition. It can be calculated using the following equation:
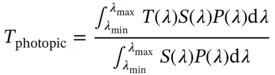
where T photopicis the photopic transmittance, T ( λ ) is the spectral transmittance of the device, S ( λ ) is the normalized spectral emittance of a 6000 K blackbody, and P ( λ ) is the normalized spectral response of the eye. λ minand λ maxdefine the considered range of wavelengths.
1.3.2 Switching Time
In the context of electrochromism, the switching time ( t ) can be defined as the time needed for EC materials to switch from one redox state to the other. It is generally followed by a square wave potential step method coupled with optical spectroscopy. Switching time depends on several parameters, such as the ability of the electrolyte to conduct ions as well as the ease of intercalation and deintercalation of ions across the EC active layer, the electrical resistances of electrolytes, and the transparent conducting films. Usually the liquid electrolyte has a lower resistance than the solid electrolyte; therefore the half device and the liquid electrolyte ECD will exhibit a rapid switching than solid ECD. Meanwhile, the large area ECD such as the large smart windows will show a lower switching compared with the small laboratory samples due to the larger electrical resistances of transparent conducting films. However, fast switching is not required in all applications, such as the switchable window technologies; the obvious color change process will increase the fun of user experience. Conversely, the sub‐second magnitude rapid switching is particularly desired for display applications.
Usually the switching times are evaluated at the λ maxor 555 nm together with the EC contrast. Therefore there are two kinds of switching time. One is electrochemical switching time, as shown in Figure 1.6a, which is the time required for the current density to change by 90% or 95% between two constant voltages. Meanwhile the switching time of oxidization ( t oxidization) and reduction ( t reduction) process can be estimated from this curve. The other is optical switching time ( Figure 1.6b), which defines the time needed for the transmittance to change by 90% or 95%. Correspondingly, the coloration switching time ( t coloration) and bleaching switching time ( t bleaching) are recorded in this measurement. It is worth noting that the pulse length of potential step has influence in transmittance. A shorter potential step will achieve a smaller contrast, and longer potential will allow EC materials to reach stationary transmittance value in both coloration and bleaching state. But after a certain length, continuing increase the pulse length won't boost the contrast. Therefore the pulse length that just reached the highest contrast are applied to switching time as well as contrast tests.
Читать дальшеИнтервал:
Закладка:
Похожие книги на «Organic Electronics for Electrochromic Materials and Devices»
Представляем Вашему вниманию похожие книги на «Organic Electronics for Electrochromic Materials and Devices» списком для выбора. Мы отобрали схожую по названию и смыслу литературу в надежде предоставить читателям больше вариантов отыскать новые, интересные, ещё непрочитанные произведения.


Обсуждение, отзывы о книге «Organic Electronics for Electrochromic Materials and Devices» и просто собственные мнения читателей. Оставьте ваши комментарии, напишите, что Вы думаете о произведении, его смысле или главных героях. Укажите что конкретно понравилось, а что нет, и почему Вы так считаете.