Euclid Seeram - A Comprehensive Guide to Radiographic Sciences and Technology
Здесь есть возможность читать онлайн «Euclid Seeram - A Comprehensive Guide to Radiographic Sciences and Technology» — ознакомительный отрывок электронной книги совершенно бесплатно, а после прочтения отрывка купить полную версию. В некоторых случаях можно слушать аудио, скачать через торрент в формате fb2 и присутствует краткое содержание. Жанр: unrecognised, на английском языке. Описание произведения, (предисловие) а так же отзывы посетителей доступны на портале библиотеки ЛибКат.
- Название:A Comprehensive Guide to Radiographic Sciences and Technology
- Автор:
- Жанр:
- Год:неизвестен
- ISBN:нет данных
- Рейтинг книги:4 / 5. Голосов: 1
-
Избранное:Добавить в избранное
- Отзывы:
-
Ваша оценка:
A Comprehensive Guide to Radiographic Sciences and Technology: краткое содержание, описание и аннотация
Предлагаем к чтению аннотацию, описание, краткое содержание или предисловие (зависит от того, что написал сам автор книги «A Comprehensive Guide to Radiographic Sciences and Technology»). Если вы не нашли необходимую информацию о книге — напишите в комментариях, мы постараемся отыскать её.
Designed to support students preparing to sit certification and board examinations, including the American Registry for Radiologic Technologists (ARRT) and other global radiography certification examinations. Addresses the core radiographic science components of the ASRT curriculum, including digital imaging production and equipment, radiation protection and safety, and the principles of Computed Tomography. Useful for students and practitioners in diagnostic medical radiation technology, radiography and medical radiation sciences, as well as in biomedical engineering technology.
A Comprehensive Guide to Radiographic Sciences and Technology — читать онлайн ознакомительный отрывок
Ниже представлен текст книги, разбитый по страницам. Система сохранения места последней прочитанной страницы, позволяет с удобством читать онлайн бесплатно книгу «A Comprehensive Guide to Radiographic Sciences and Technology», без необходимости каждый раз заново искать на чём Вы остановились. Поставьте закладку, и сможете в любой момент перейти на страницу, на которой закончили чтение.
Интервал:
Закладка:
The major system components of a FPDR system are shown in Figure 2.6and include an x‐ray generator, an x‐ray tube, a flat‐panel digital detector, a computer, an image display monitor, and finally a digital communications system.
The flat‐panel digital detectors for FPDR fall into two categories, namely, the indirect conversion digital detector and the direct conversion digital detector. A significant difference between CR and FPDR systems is that the latter does not include a separate physical image reader but rather a digital processor is included in the design of the flat‐panel detector, so that the latent image formed on the detector is subsequently rendered visible by the built‐in digital processor. The image is then displayed on a monitor for viewing and interpretation.
Digital fluoroscopy
Fluoroscopy produces dynamic images acquired in real‐time to allow for the study of motion of organ systems and hollow internal structures such as the gastrointestinal tract, as well as blood circulatory system. The major system components of a DF system ( Figure 2.7) consist of a flat‐panel digital detector to allow for the creation of real‐time dynamic images processed by a computer and subsequently displayed as a square image on the viewing monitor, compared to a circular image typical of the older image intensifier‐based DF systems. This display method eliminates what is known as pin cushion distortion effects characteristic of the older digital fluoroscopic systems.
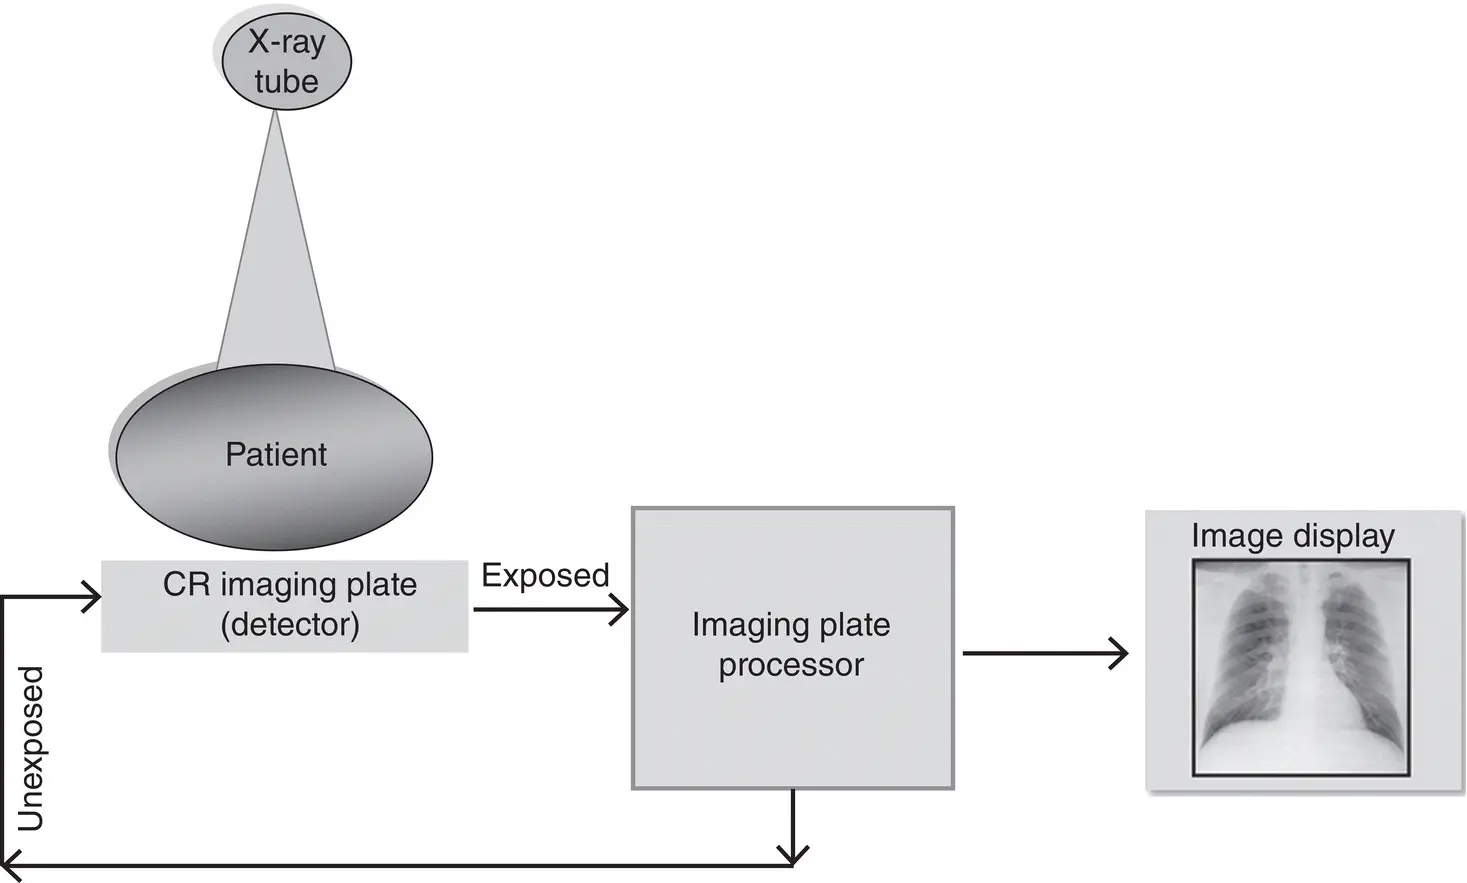
Figure 2.5 The major components of a CR system include the imaging plate (IP), the IP processor, IP erasure, and image display monitor.
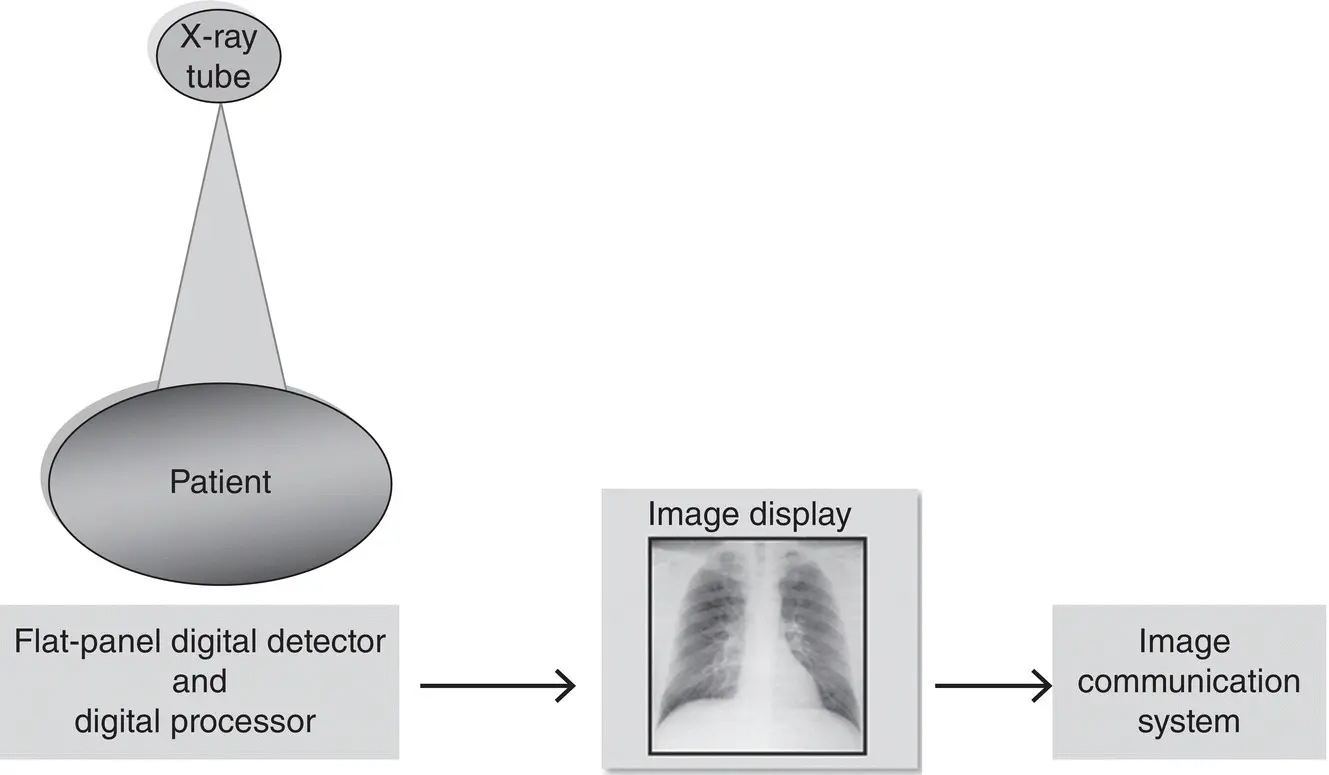
Figure 2.6 The major system components of a FPDR system include an x‐ray generator, an x‐ray tube, a flat‐panel digital detector, a computer, an image display monitor, and finally a digital communications system.
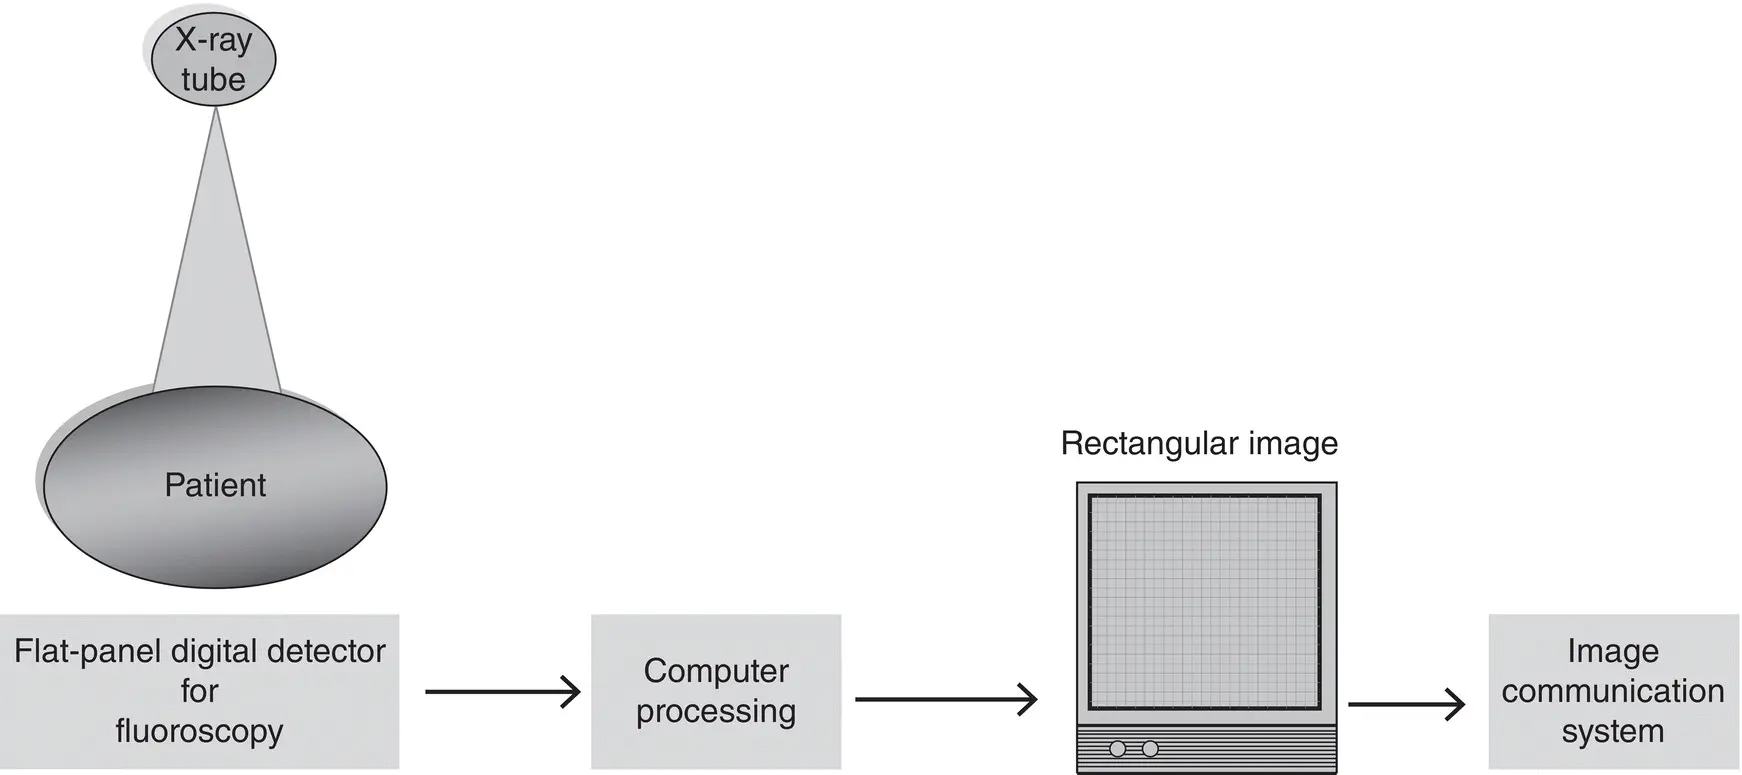
Figure 2.7 The major system components of a DF system consist of a flat‐panel digital detector to allow for the creation of real‐time dynamic images processed by a computer and subsequently display the image as a square image on the viewing monitor, compared to a circular image typical of the older image intensifier‐based digital fluoroscopy systems. This display method eliminates what is known as pin cushion distortion effects characteristic of the older digital fluoroscopic systems.
Digital mammography
Major components of a DM system currently utilize CR detectors and flat‐panel digital detectors including direct and indirect conversion detectors to image the breast. Image acquisition and processing is similar to that described above for FPDR. Additionally, associated applications of DM include DBT and DRT. While DBT is designed to examine only the breast, DRT images other body regions, such as the chest abdomen, extremities, for example. The basic concept of DBT and DRT is related to the principle underlying conventional tomography, in which the x‐ray tube moves through various angles (limited arc) while the detector is stationary, capturing several images during the sweep, as illustrated in Figure 2.8. These images are subsequently subjected to image reconstruction algorithms and digital image processing to enhance the visualization of image features.
Computed tomography
CT is a sectional imaging technique that produces direct cross‐sectional digital images referred to as transverse axial images. These images have been defined as planar sections that are perpendicular to the long axis of the patient. In CT, the patient is scanned as the x‐ray tube coupled to special electronic detectors rotate around the patient to collect and measure attenuation readings as shown in Figure 2.9. Furthermore, the raw data from the detectors are sent to a computer which uses an image reconstruction algorithm to build up images of the anatomy scanned. These images are subsequently displayed for viewing and interpretation, after which they are sent to an image communication system for storage, archiving, and communication to various remote locations, if needed.
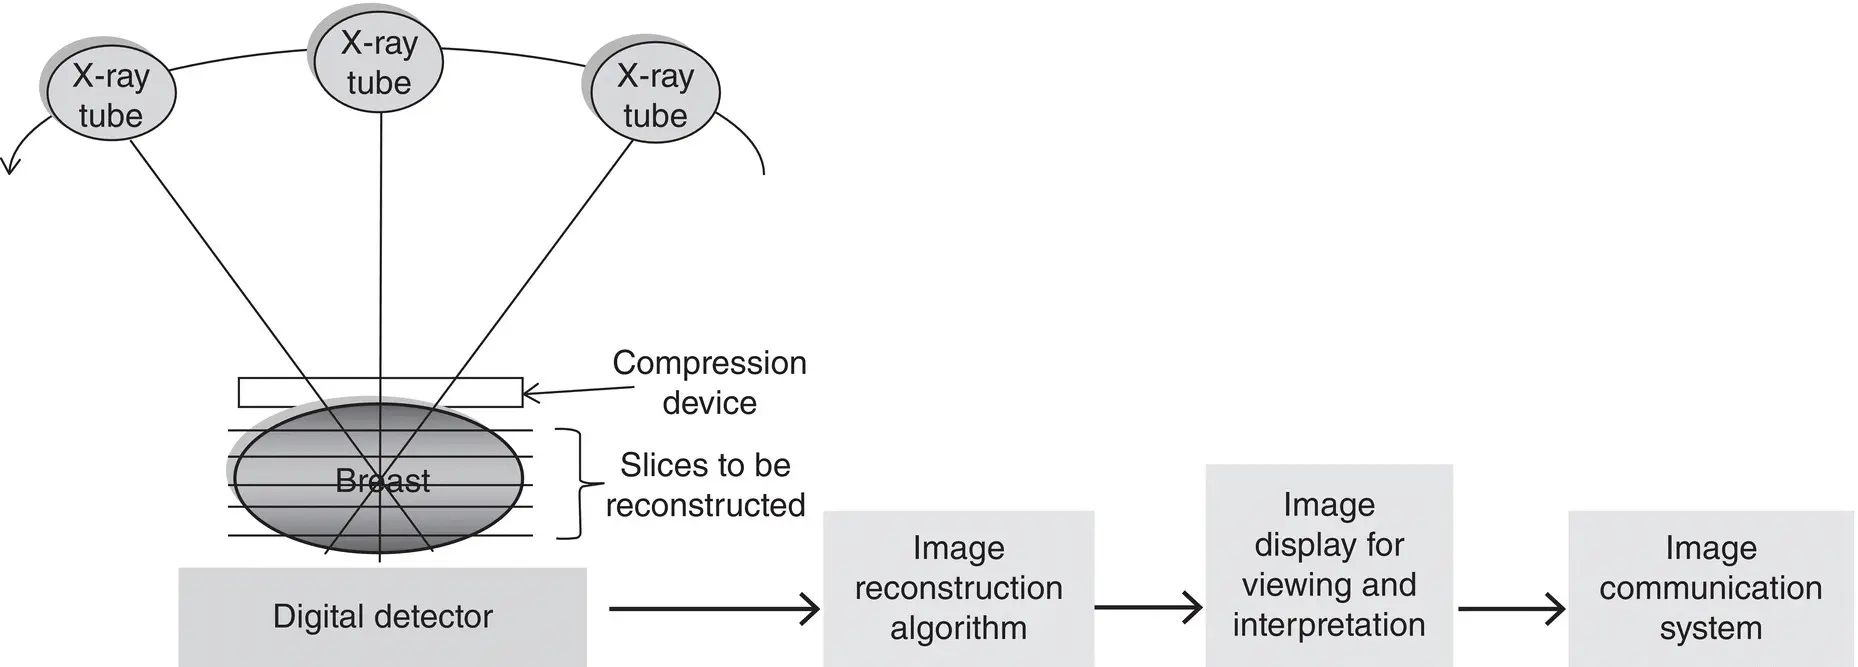
Figure 2.8 The basic concept for DBT and DRT is related to the principle underlying conventional tomography, in which the x‐ray tube moves through various angles (limited arc) while the detector is stationary, capturing several images during the sweep. See text for further explanation.
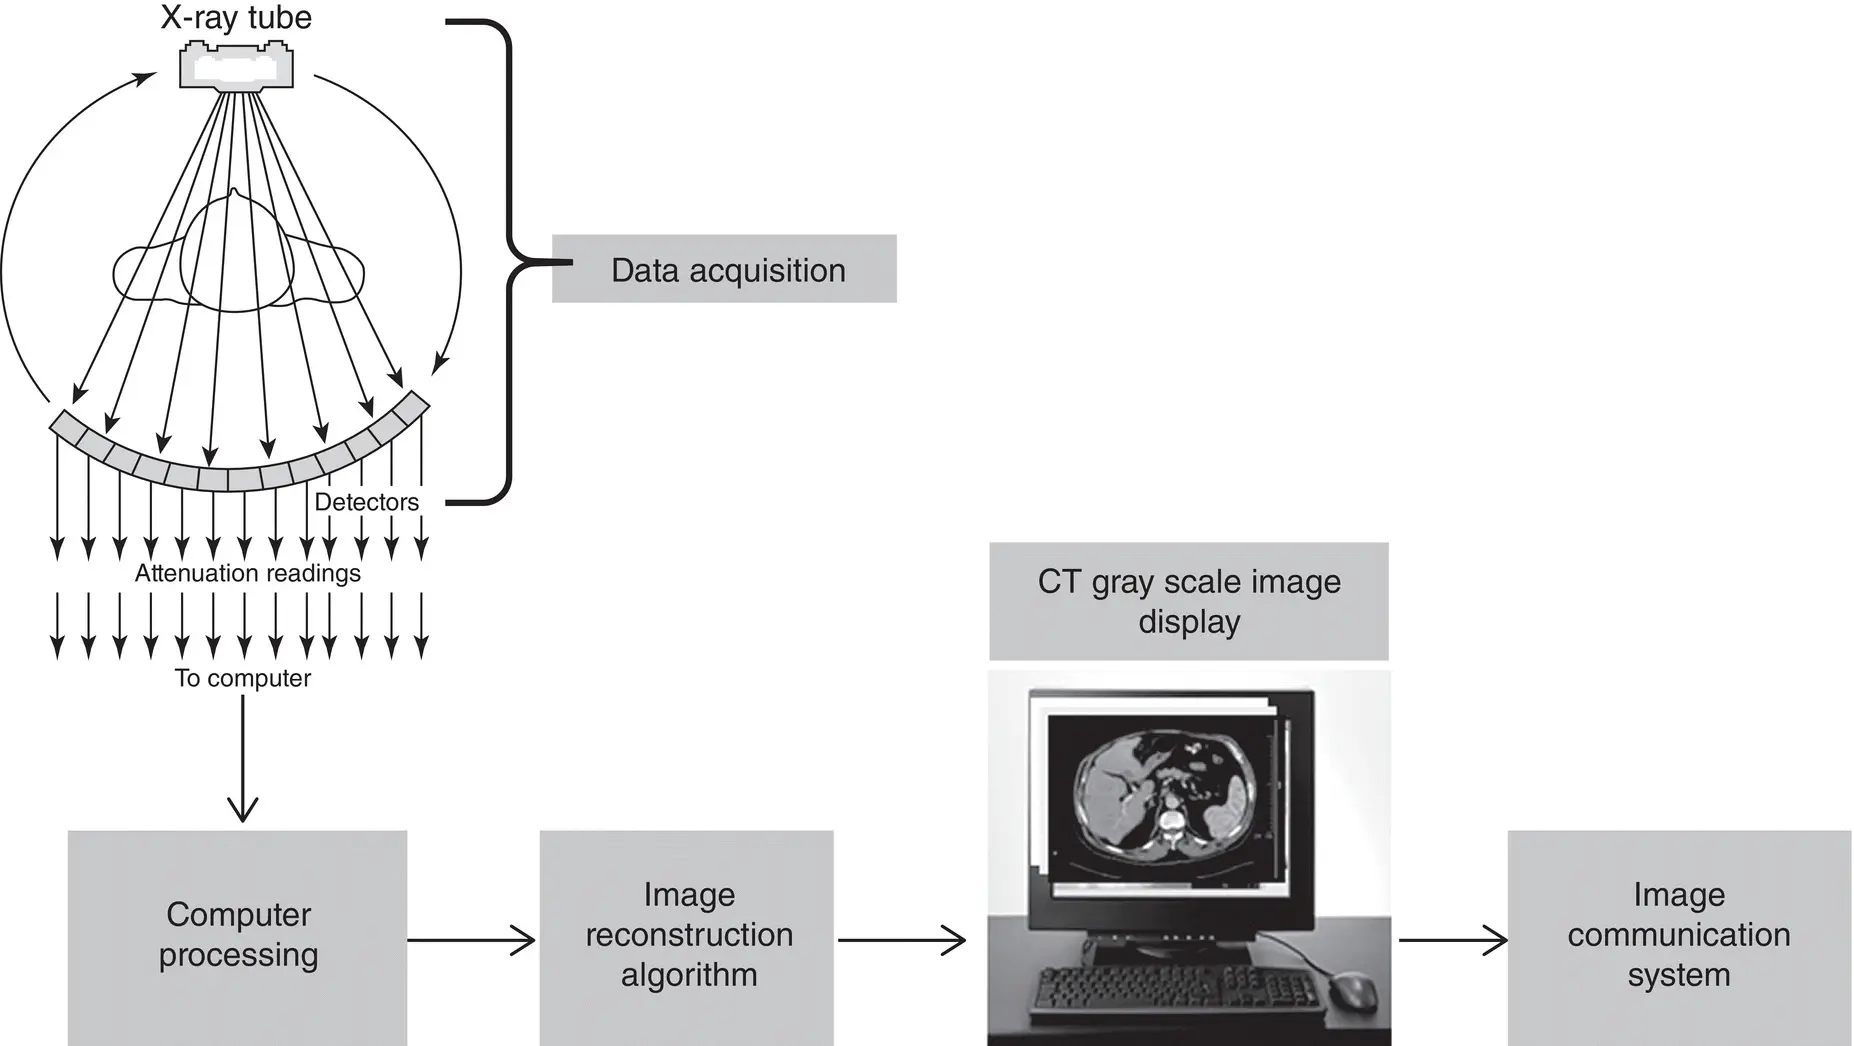
Figure 2.9 In CT, the patient is scanned as the x‐ray tube coupled to special electronic detectors rotate around the patient to collect and measure attenuation readings as illustrated.
IMAGE COMMUNICATION SYSTEMS
Image communication systems include picture archiving and communication systems (PACS) and information systems, including hospital information systems (HIS) and radiology information systems (RIS); Cloud PACS, a technology derived from cloud computing; Vendor Neutral Archives (VNAs); and Enterprise Imaging.
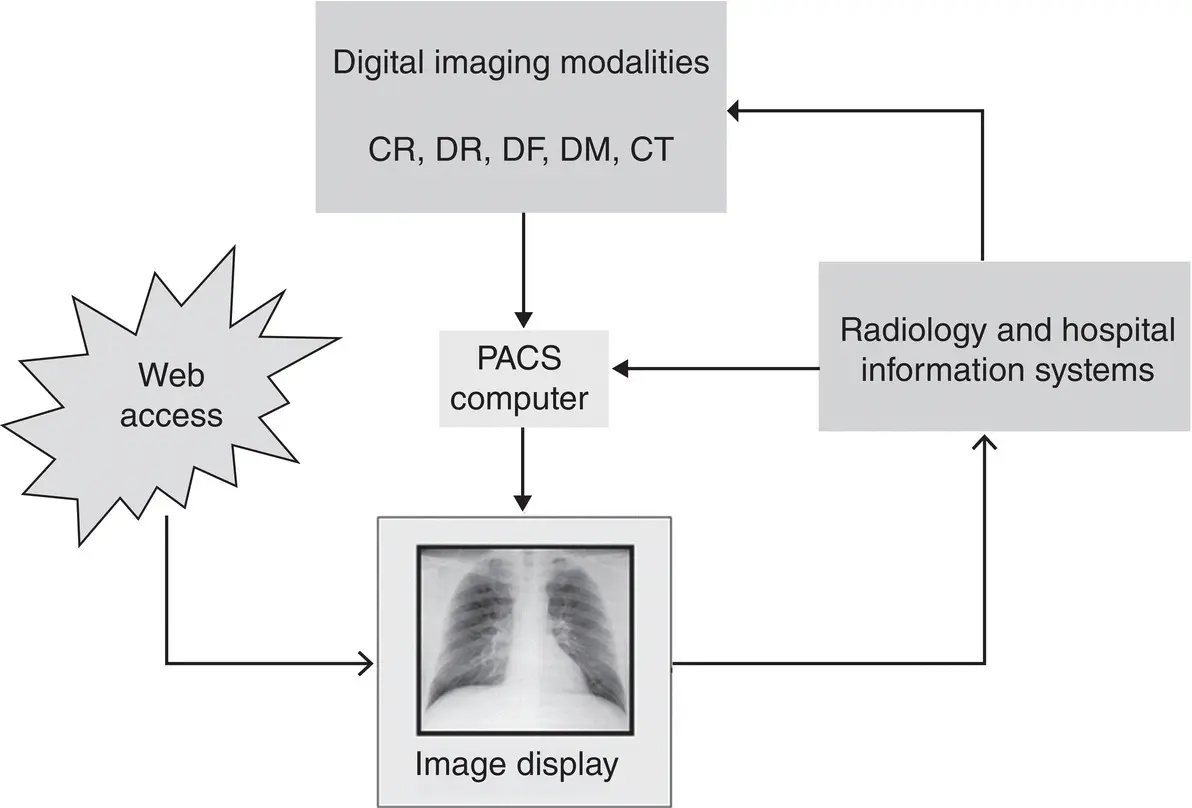
Figure 2.10 The major system components of a PACS make use of digital technologies for storage, display, and communication of digital images acquired by all digital modalities. Furthermore, a computer system performs tasks of image storage, archiving, and image processing.
Picture archiving and communication system
The PACS is a significant component in a DR environment. A PACS makes use of digital technologies for storage, display, and communication of digital images acquired by all digital modalities. As illustrated in Figure 2.10, the system consists of a number of components such as a computer system that performs tasks of image storage, archiving, and image processing. Coupled to a large‐scale PACS are the information systems : the RIS and the HIS. Furthermore, the PACS can be accessed via the Internet as well.
Image communication systems continue to evolve into systems intended to improve the performance of PACS. These technologies include Cloud PACS , a technology derived from cloud computing ; VNAs ; and Enterprise Imaging . These systems are described in detail by Seeram [5].
References
1 1. Seibert, J.A. and Morin, R.L. (2011). The standardized exposure index for digital radiography: an opportunity for optimization of radiation dose to the pediatric population. Pediatr. Radiol. 41: 573–581.
2 2. Seeram, E., Davidson, R., Bushong, S., and Swan, H. (2016). Optimizing the exposure indicator as a dose management strategy in computed radiography. Radiol. Technol. 87 (4): 380–391.
Читать дальшеИнтервал:
Закладка:
Похожие книги на «A Comprehensive Guide to Radiographic Sciences and Technology»
Представляем Вашему вниманию похожие книги на «A Comprehensive Guide to Radiographic Sciences and Technology» списком для выбора. Мы отобрали схожую по названию и смыслу литературу в надежде предоставить читателям больше вариантов отыскать новые, интересные, ещё непрочитанные произведения.


Обсуждение, отзывы о книге «A Comprehensive Guide to Radiographic Sciences and Technology» и просто собственные мнения читателей. Оставьте ваши комментарии, напишите, что Вы думаете о произведении, его смысле или главных героях. Укажите что конкретно понравилось, а что нет, и почему Вы так считаете.