Rudy Bilous - Handbook of Diabetes
Здесь есть возможность читать онлайн «Rudy Bilous - Handbook of Diabetes» — ознакомительный отрывок электронной книги совершенно бесплатно, а после прочтения отрывка купить полную версию. В некоторых случаях можно слушать аудио, скачать через торрент в формате fb2 и присутствует краткое содержание. Жанр: unrecognised, на английском языке. Описание произведения, (предисловие) а так же отзывы посетителей доступны на портале библиотеки ЛибКат.
- Название:Handbook of Diabetes
- Автор:
- Жанр:
- Год:неизвестен
- ISBN:нет данных
- Рейтинг книги:3 / 5. Голосов: 1
-
Избранное:Добавить в избранное
- Отзывы:
-
Ваша оценка:
Handbook of Diabetes: краткое содержание, описание и аннотация
Предлагаем к чтению аннотацию, описание, краткое содержание или предисловие (зависит от того, что написал сам автор книги «Handbook of Diabetes»). Если вы не нашли необходимую информацию о книге — напишите в комментариях, мы постараемся отыскать её.
Now in its fifth edition, this market-leading book aligns with the most recent guidelines from the American Diabetes Association (ADA), the European Association for the Study of Diabetes (EASD), Diabetes UK, and the National Institute for Health and Care Excellence (NICE), presenting authoritative clinical coverage of diabetes in an accessible format with rich pedagogical features.
Five new chapters provide detailed coverage of liver disease, diabetes education, bariatric surgery, diabetes and cancer, and the use of incretin-based therapies and SGLT2 Inhibitors in the management of Type II diabetes Updated and expanded topics include the relation between hypoglycaemia and dementia, anxiety and depression, the NICE Quality and Outcomes Framework (QOF), and the impacts of diabetes to self-care, mental health, and decision-making Provides a wealth of pedagogical features such as vignettes and case histories, important learning points, summaries of key clinical trials, and links to further readings
remains the essential practical companion for all health professionals involved in managing patients with diabetes, and an up-to-date reference for diabetes and endocrinology researchers, scientists, and academics.
Handbook of Diabetes — читать онлайн ознакомительный отрывок
Ниже представлен текст книги, разбитый по страницам. Система сохранения места последней прочитанной страницы, позволяет с удобством читать онлайн бесплатно книгу «Handbook of Diabetes», без необходимости каждый раз заново искать на чём Вы остановились. Поставьте закладку, и сможете в любой момент перейти на страницу, на которой закончили чтение.
Интервал:
Закладка:
Thrifty phenotype hypothesis
A link between low birthweight and later development of type 2 diabetes in a UK population has led to a hypothesis linking foetal malnutrition to impaired β cell development and insulin resistance in adulthood. Abundant adult nutrition and consequent obesity would then expose these problems, leading to IGT and eventually type 2 diabetes. This has been called the thrifty phenotype hypothesis ( Figure 7.15).
A meta‐analysis of 31 populations involving 152,084 individuals from varying ethnic groups and 6090 cases of diabetes was published in 2008. This confirmed a negative association between birthweight and diabetes in 23, but found a positive association in eight studies. The combined odds ratio for type 2 diabetes was 0.8 (95% CI 0.72–0.89) for each 1 kg increase in birthweight. This relationship was strengthened if macrosomic (birthweight >4 kg) and offspring of mothers with known type 2 diabetes were excluded (odds ratio (OR) 0.67, 95% CI 0.61–0.73). Notably there was a tendency for a positive relationship in North American populations largely due to higher rates of maternal obesity and gestational diabetes. Adjustment for socio‐economic status had no effect, but adjustment for achieved adult BMI attenuated the relationship.
With increasing maternal obesity and gestational diabetes mellitus (GDM), it is conceivable that the relationship will change to the pattern currently seen in Native Americans which is more U‐shaped. However, it is still unclear whether low birthweight is a causative factor or a sign of other potential mechanisms which may predispose to later diabetes.
Metabolic syndrome
The aggregation of obesity, hyperglycaemia, hypertension, and dyslipidaemia (high TG’s and low HDL‐cholesterol) in people with both type 2 diabetes and cardiovascular disease is termed the metabolic syndrome ( Table 7.1).
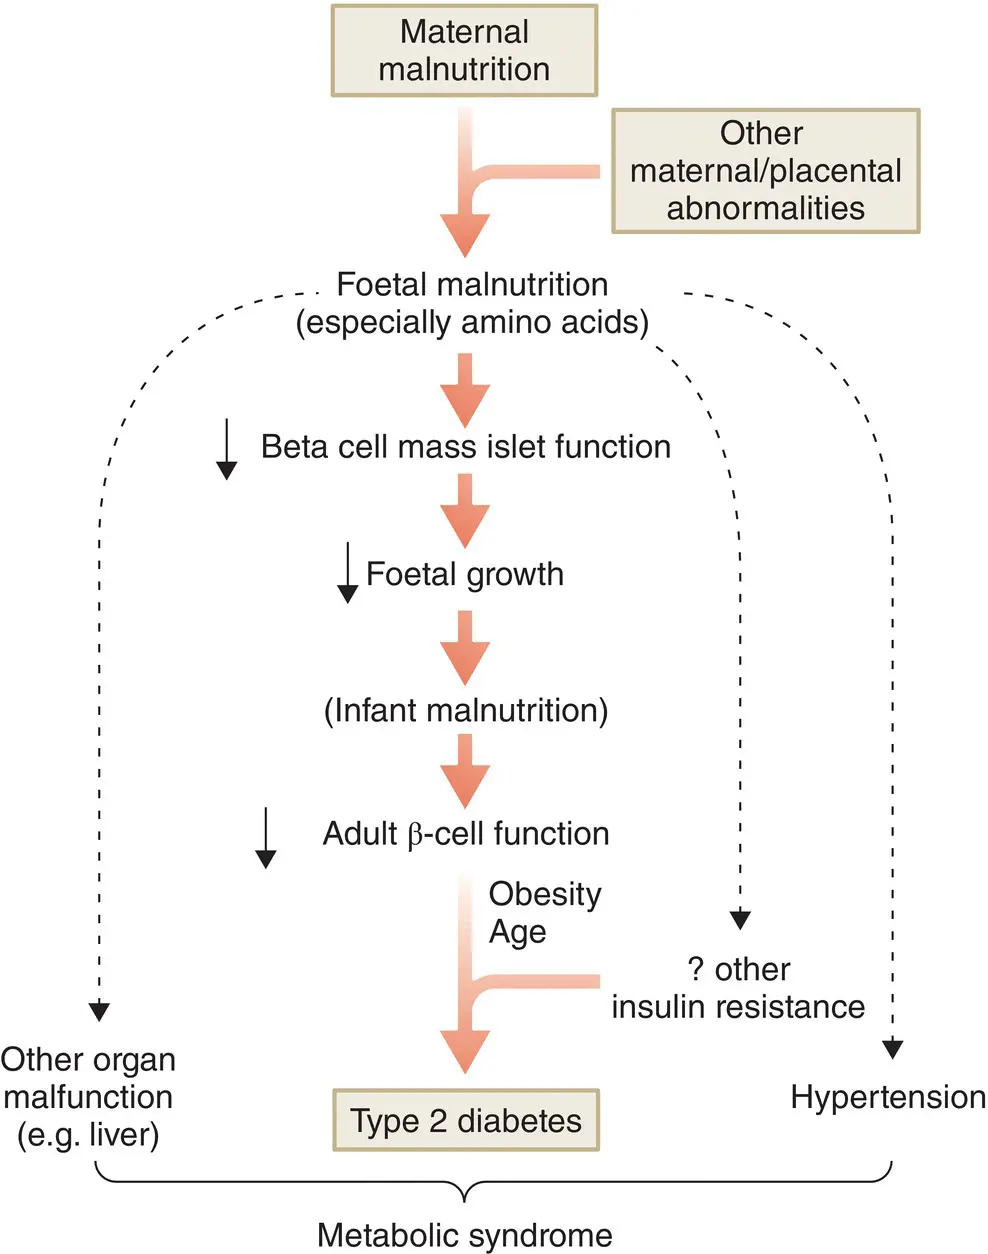
Figure 7.15 The ‘thrifty phenotype’ hypothesis.
Since several definitions appeared, there has been considerable debate as to their relative strengths and weaknesses. Indeed, there is some debate as to whether this constitutes a true syndrome at all and whether they add anything to predictive models for type 2 diabetes and coronary artery disease. A major problem is the correlation of many of the features. In prospective studies, fasting plasma glucose (FPG) is overwhelmingly linked to subsequent development of diabetes, but much less so with coronary artery disease. Thus, the predictive utility of the metabolic syndrome as a concept adds little to its constituent risk factors when they are used individually. The long‐term usefulness of the definition of the metabolic syndrome for identification and intervention in order to prevent diabetes and cardiovascular disease has yet to be demonstrated.
β cell dysfunction
Type 2 diabetes develops because of a progressive deterioration of β cell function, coupled with increasing insulin resistance for which the β cell cannot compensate. At the time of diagnosis β cell function is already reduced by about 50% and continues to decline regardless of therapy ( Figure 7.16).
The main defects in β cell function in type 2 diabetes are a markedly reduced first‐ and second‐phase insulin response to intravenous glucose, and a delayed or blunted response to mixed meals ( Figure 7.17). There are also alterations in pulsatile and daytime oscillations of insulin release. Some researchers have also found increases in the proportions of plasma proinsulin and split proinsulin peptides relative to insulin alone. Many of these abnormalities can be found in people with IGT and even in normoglycaemic first‐degree relatives of people with type 2 diabetes, indicating that impaired β cell function is an early and possibly genetic defect in the natural history of type 2 diabetes ( Figure 7.18).
Table 7.1 Definition of metabolic syndrome.
Source: NCEP ATP III, National Cholesterol Education Programme – 3rd Adult Treatment Panel; IDF, International Diabetes Federation.
| Risk factor | Defining level | |
|---|---|---|
| NCEP ATP III | IDF | |
| Abdominal obesity (waist circumference) | ||
| Men | >102 cm | ≥94 cm (Europid) ≥90 cm (others) |
| Women | >88 cm | ≥80 cm for all |
| Plasma triglycerides | ≥1.7 mmol/L | ≥1.7 mmol/L |
| Plasma HDL cholesterol | ||
| Men | <0.9 mmol/L | <1.03 mmol/L |
| Women | <1.1 mmol/L | <1.29 mmol/L |
| Blood pressure | ≥130/≥85 mmHg | ≥130/≥85 mmHg or on treatment |
| Plasma fasting glucose | ≥6.1 mmol/L | ≥5.6 mmol/L or pre‐existing type 2 diabetes |
| Diagnostic criteria | 3 or more of the above | Obesity plus 2 others |
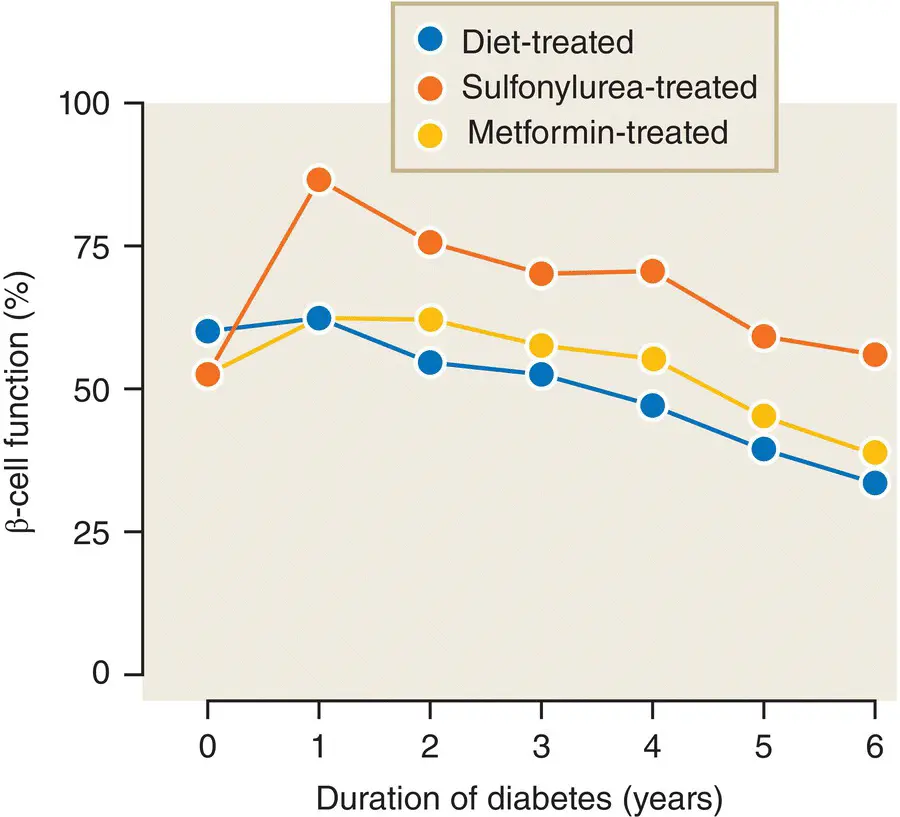
Figure 7.16 β‐cell function as measured by the homeostasis model assessment (HOMA) method (calculated from the fasting blood glucose and insulin concentrations) in patients with type 2 diabetes from the UKPDS. β cell function is already reduced to 50% at diagnosis and declines thereafter, despite therapy.
Data from Hales and Barker. Diabetologia 1992; 35: 595–601.
The most common histological abnormality found in the islets of patients with type 2 diabetes is the presence of insoluble amyloid fibrils lying outside the cells. These are derived from islet amyloid polypeptide (IAPP, also sometimes known as amylin). This is co‐secreted with insulin in a molar ratio of 1:10–50. Although IAPP is reported to impair insulin secretion and to be toxic to the β cell, its precise role in the pathogenesis of type 2 diabetes is uncertain because deposits can be found in up to 20% of elderly people who had completely normal glucose tolerance in life (See Figure 7.19).
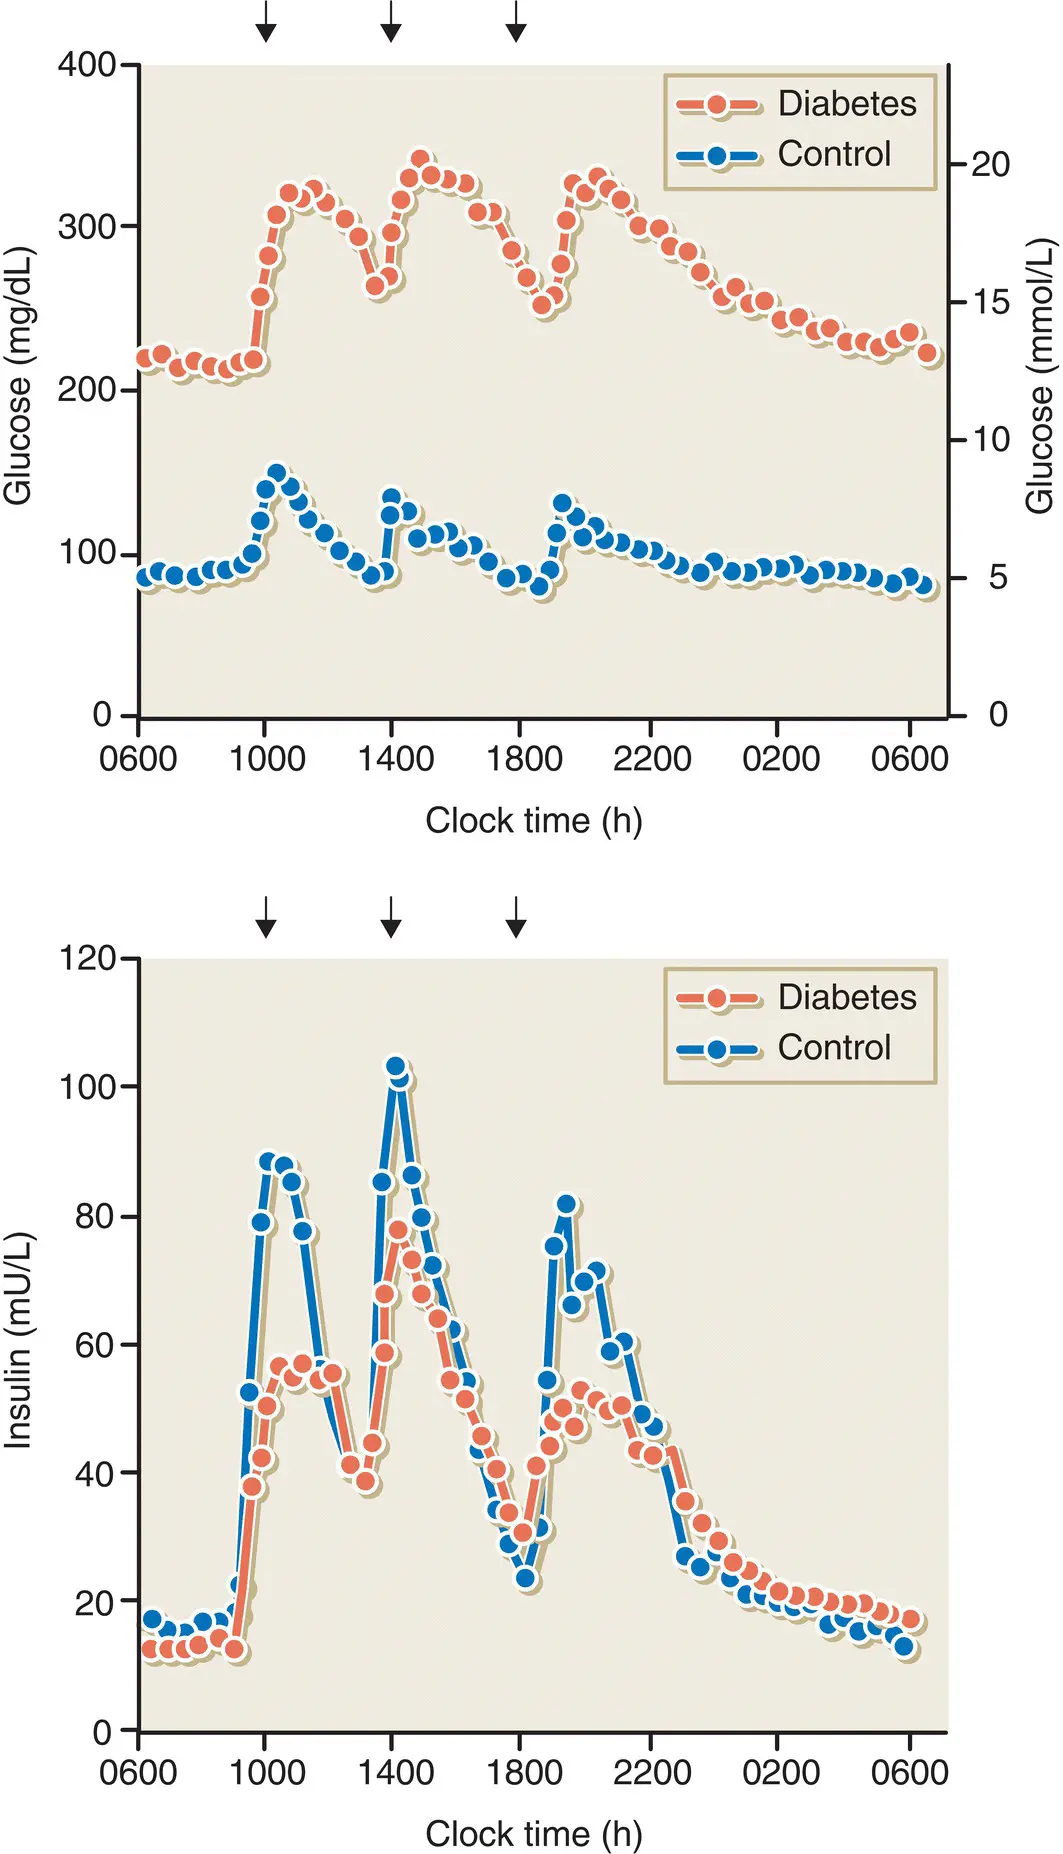
Figure 7.17 Plasma concentrations of glucose and insulin in subjects with type 2 diabetes and control subjects without diabetes in response to mixed meals.
Data from UK Prospective Diabetes Study Group. Diabetes 1995; 44:1249–1258.

Figure 7.18 The stages of glucose tolerance and associated β cell function and insulin sensitivity, from normal glucose tolerance (NGT) through impaired glucose tolerance (IGT), with or without impaired fasting glucose (IFG), and finally type 2 diabetes mellitus (DM).
Courtesy of Dr H Lewis Jones, Liverpool University, UK.
β Cell mass is thought to be decreased by only 20–40% in type 2 diabetes and this clearly cannot explain the >80% reduction in insulin release that is observed. There must therefore be additional functional defects in the β cell, perhaps mediated by glucose or lipid toxicity. It is likely that IAPP contributes to this process.
Conclusion
Both insulin resistance and β cell dysfunction are early features of glucose intolerance and type 2 diabetes. There has been much debate as to whether one is the primary defect that precedes the other. In practice, the contribution of insulin resistance and β cell dysfunction varies considerably between patients, as well as during the course of the disease. Usually, there is a decline in both insulin sensitivity and insulin secretion in patients who progress from IGT to type 2 diabetes and undoubtedly environmental and genetic factors contribute to this process ( Figure 7.11).
Читать дальшеИнтервал:
Закладка:
Похожие книги на «Handbook of Diabetes»
Представляем Вашему вниманию похожие книги на «Handbook of Diabetes» списком для выбора. Мы отобрали схожую по названию и смыслу литературу в надежде предоставить читателям больше вариантов отыскать новые, интересные, ещё непрочитанные произведения.


Обсуждение, отзывы о книге «Handbook of Diabetes» и просто собственные мнения читателей. Оставьте ваши комментарии, напишите, что Вы думаете о произведении, его смысле или главных героях. Укажите что конкретно понравилось, а что нет, и почему Вы так считаете.