Rudy Bilous - Handbook of Diabetes
Здесь есть возможность читать онлайн «Rudy Bilous - Handbook of Diabetes» — ознакомительный отрывок электронной книги совершенно бесплатно, а после прочтения отрывка купить полную версию. В некоторых случаях можно слушать аудио, скачать через торрент в формате fb2 и присутствует краткое содержание. Жанр: unrecognised, на английском языке. Описание произведения, (предисловие) а так же отзывы посетителей доступны на портале библиотеки ЛибКат.

- Название:Handbook of Diabetes
- Автор:
- Жанр:
- Год:неизвестен
- ISBN:нет данных
- Рейтинг книги:3 / 5. Голосов: 1
-
Избранное:Добавить в избранное
- Отзывы:
-
Ваша оценка:
Handbook of Diabetes: краткое содержание, описание и аннотация
Предлагаем к чтению аннотацию, описание, краткое содержание или предисловие (зависит от того, что написал сам автор книги «Handbook of Diabetes»). Если вы не нашли необходимую информацию о книге — напишите в комментариях, мы постараемся отыскать её.
Now in its fifth edition, this market-leading book aligns with the most recent guidelines from the American Diabetes Association (ADA), the European Association for the Study of Diabetes (EASD), Diabetes UK, and the National Institute for Health and Care Excellence (NICE), presenting authoritative clinical coverage of diabetes in an accessible format with rich pedagogical features.
Five new chapters provide detailed coverage of liver disease, diabetes education, bariatric surgery, diabetes and cancer, and the use of incretin-based therapies and SGLT2 Inhibitors in the management of Type II diabetes Updated and expanded topics include the relation between hypoglycaemia and dementia, anxiety and depression, the NICE Quality and Outcomes Framework (QOF), and the impacts of diabetes to self-care, mental health, and decision-making Provides a wealth of pedagogical features such as vignettes and case histories, important learning points, summaries of key clinical trials, and links to further readings
remains the essential practical companion for all health professionals involved in managing patients with diabetes, and an up-to-date reference for diabetes and endocrinology researchers, scientists, and academics.
Handbook of Diabetes — читать онлайн ознакомительный отрывок
Ниже представлен текст книги, разбитый по страницам. Система сохранения места последней прочитанной страницы, позволяет с удобством читать онлайн бесплатно книгу «Handbook of Diabetes», без необходимости каждый раз заново искать на чём Вы остановились. Поставьте закладку, и сможете в любой момент перейти на страницу, на которой закончили чтение.
Интервал:
Закладка:

Figure 7.4 Age‐adjusted prevalence rates of type 2 diabetes in different geographical regions of the world, as monitored by the International Diabetes Federation (IDF). IDF 2017.
© International Diabetes Federation.
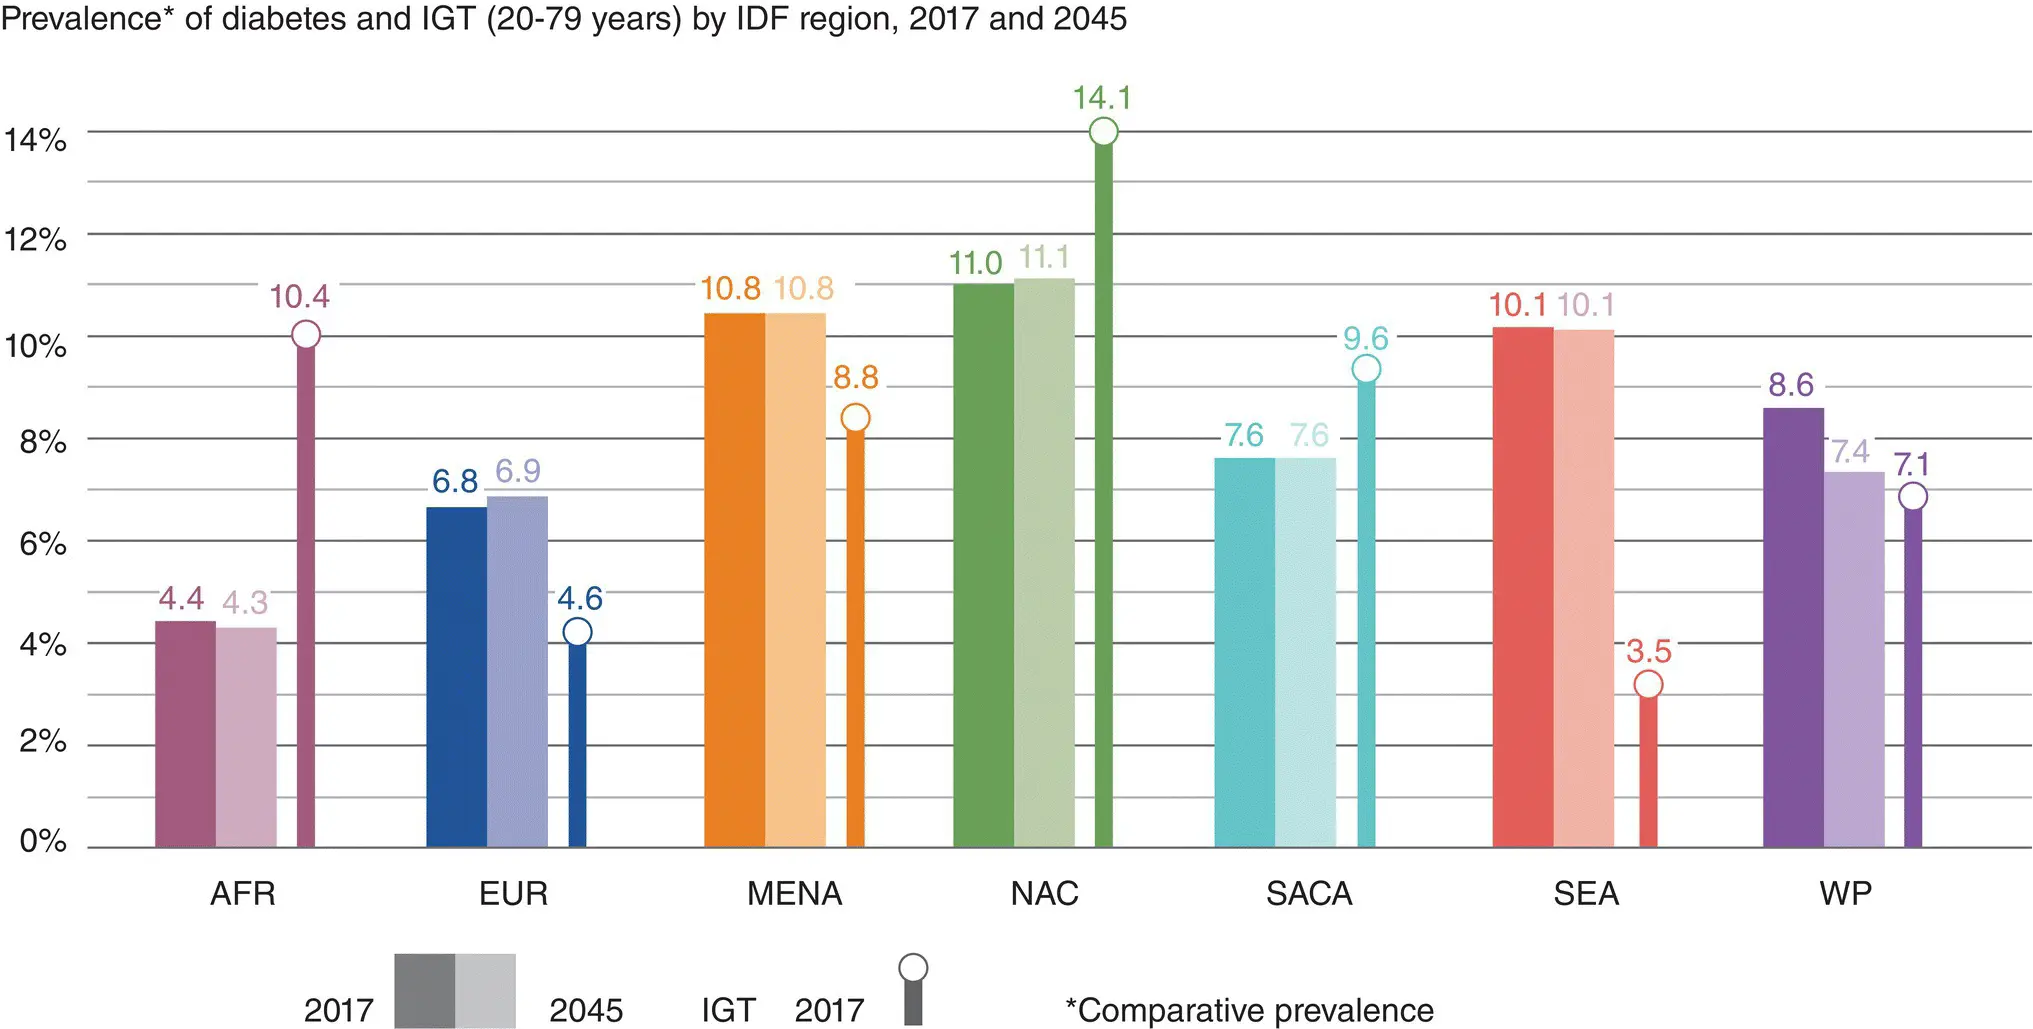
Figure 7.5 The IDF atlas also monitors the rising prevalence of prediabetes (impaired glucose tolerance) in different geographical regions. IDF Diabetes Atlas. © 2017 International Diabetes Federation.
In Europe, comparative prevalence rates vary from 1.6% in Iceland to 7.9% in Germany, Austria and Switzerland. The UK prevalence rate is 2.9% (age adjusted) and 4.0% (absolute), increasing to 3.5% and 4.6% respectively by 2025.
Diabetes caused 1.5 million deaths in 2012. Higher‐than‐optimal blood glucose caused an additional 2.2 million deaths ( Figure 7.7and 7.8). Of these deaths, 43% occur before the age of 70, and the proportion of deaths attributable to high glucose is highest in low‐ and middle‐income countries.
Urban versus rural
There is a clear trend for rates of diabetes to increase in populations as they move from a rural to an urban existence. The reasons are unclear but probably relate to both decreasing physical activity as well as dietary changes. For example, rural Chinese have a prevalence of type 2 diabetes of 5%, which is less than half the rate of Singaporean Chinese (10.5%). Much larger differences are seen in South Asian, Hispanic, African, and Polynesian peoples ( Figure 7.9).
Impaired glucose tolerance
Comparative prevalence for IGT vary by region with rates almost double those for type 2 diabetes in Africa, but slightly lower elsewhere ( Figure 7.5). These differences are almost certainly a reflection of socio‐economic factors as well as a paucity of studies in many African countries where extrapolation is necessary between very different populations. In Europe, the comparative prevalence will increase slightly from 9.1% in 2007 to 9.6% in 2025, representing an absolute change from 65.3 to 71.2 million (UK figures 4.7% to 4.9%, 2.17 to 2.4 million respectively).
Incidence
The reported incidence rates for type 2 diabetes vary according to the population under study and the year of observation. For white Europid populations, rates of 0.1–1% per annum have been reported. For Hispanic populations in the USA, rates of 2.8% were recorded in the San Antonio Study, which are similar to those of the Pima Indians in Arizona (approximately 2.5%) and the Australian aborigines (2.03%). Over the last 20 years, incidence rates among the Pima Indians has not changed, although the age of onset of type 2 diabetes has been declining.
The occurrence of type 2 diabetes in adolescence is a great cause for concern worldwide. In US Asian and Pacific Islanders, for example, rates of 12.1/100,000 patient–years have been reported in 10–19‐year‐olds, which is similar to rates reported for type 1 diabetes. In the UK, the overall incidence for <16‐year‐olds is much lower, at 0.53 per/100,000 patient–years, but 10 times more common in South Asian or black African compared to white children.
The rural–n ratio remains for diabetes incidence rates even in the presence of other risk factors such as central obesity. In Japan, there is an approximately threefold increase in the incidence among obese urban compared to rural populations (15.8 versus 5.8% over 10 years). Similarly, there is a twofold increase in incidence for USA versus Mexican Hispanic people corrected for age and economic circumstance, probably a reflection of changes in diet and lifestyle.
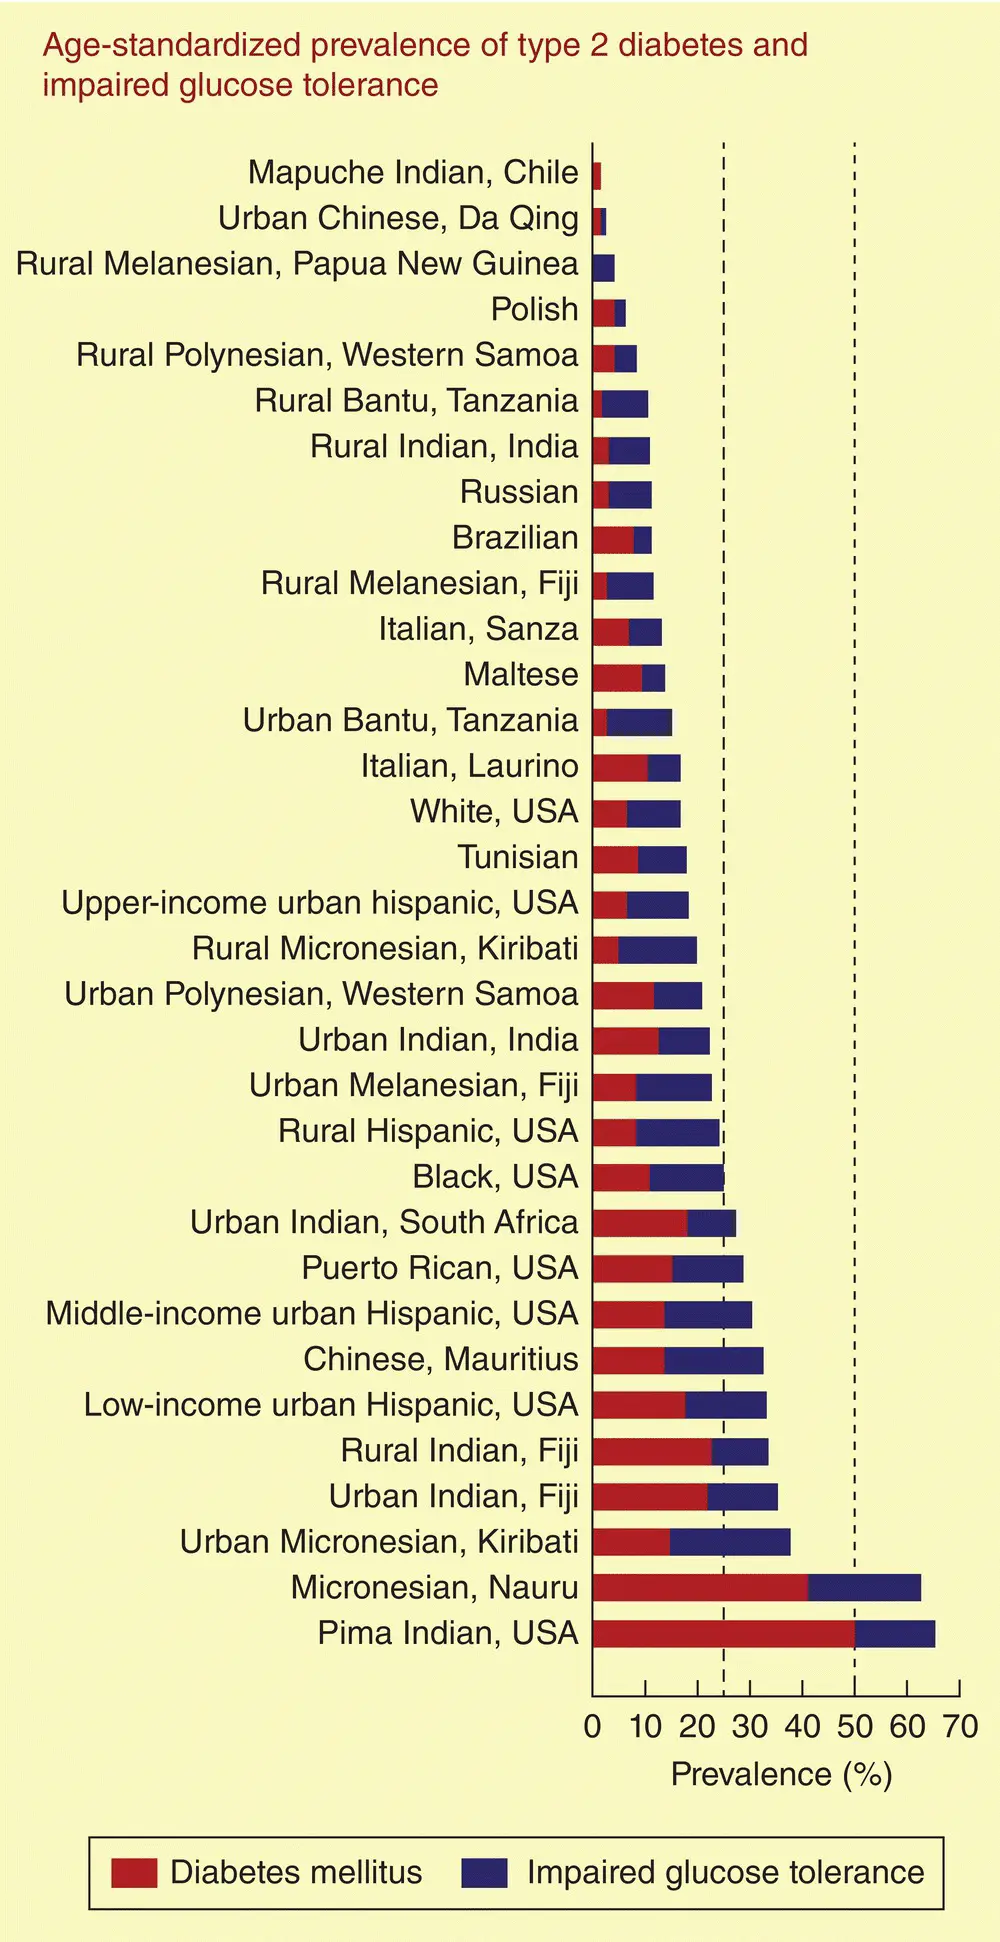
Figure 7.6 A league table of countries showing widely different prevalence rates of type 2 diabetes and impaired glucose tolerance. A mixture of genes and environment account for these differences. Forouhi NG and Wareham NJ. Medicine, 2006; 34(2): 57–60.
Risk factors for type 2 diabetes
Obesity
About 80% of people with type 2 diabetes are obese, and the risk of developing diabetes increases progressively as the BMI (weight (kg)/height (m) 2) increases ( Figure 7.1). A BMI >35 kg/m 2increases the risk of type 2 diabetes developing over a 10‐year period by 80‐fold, as compared to those with a BMI <22 kg/m 2. Small increments in body weight translate into large increases in type 2 diabetes risk ( Figure 7.10).
The latest data from the US NHANES survey confirms a 6–10‐fold higher lifetime risk of type 2 diabetes for 18‐year‐olds with a BMI >35 kg/m 2compared to those with BMI <18.5 kg/m 2, with an associated 6–7 year reduction in overall life expectancy.
Obesity is still widely defined as a BMI >30 kg/m 2although BMI is not an accurate reflection of fat mass or its distribution, particularly in Asian people. A simple waist circumference may be better. The pattern of obesity is also important in that central fat deposition is associated with greater insulin resistance and confers a much higher risk for developing diabetes compared to gluteofemoral deposition ( Figure 7.11). In clinical practice, ‘central’ obesity can be assessed by measuring the ratio of waist:hip circumference, but it is unclear whether this has any advantage over a simple measurement of waist circumference alone.
Fat deposition at other sites, particularly in skeletal muscle, liver and in the pancreatic islets, may contribute to metabolic defects and insulin resistance. This ‘ectopic’ fat deposition leads to lipotoxicity, which in turn causes insulin resistance and (in islets) impairs insulin secretion.
Physical exercise and diet
Low levels of physical exercise also predict the development of type 2 diabetes, possibly because exercise increases insulin sensitivity and helps prevent obesity ( Figure 7.12). People who exercise the most have a 25–60% lower risk of developing type 2 diabetes regardless of their other risk factors such as obesity and family history.
The Diabetes Prevention Programme and the Diabetes Prevention Study have shown that lifestyle modifications with moderate exercise and modest weight loss can dramatically reduce the number progressing from IGT to type 2 diabetes and reinforce the importance of lifestyle factors in the cause of diabetes.
Insulin resistance
Whole‐body ‘insulin resistance’ can be estimated from the amount of glucose that needs to be infused intravenously in order to maintain a constant blood glucose level during a simultaneous intravenous infusion of insulin. This (euglycaemic hyperinsulinaemic ‘clamp’) method is cumbersome, so for studying populations the HOMA (homeostasis model assessment) methods are more practical for estimating steady‐state beta‐cell function (HOMA B) and insulin sensitivity (HOMA S) as percentages of normal. These estimates can be derived from a single fasting measurement of plasma C‐peptide, insulin and glucose concentrations.
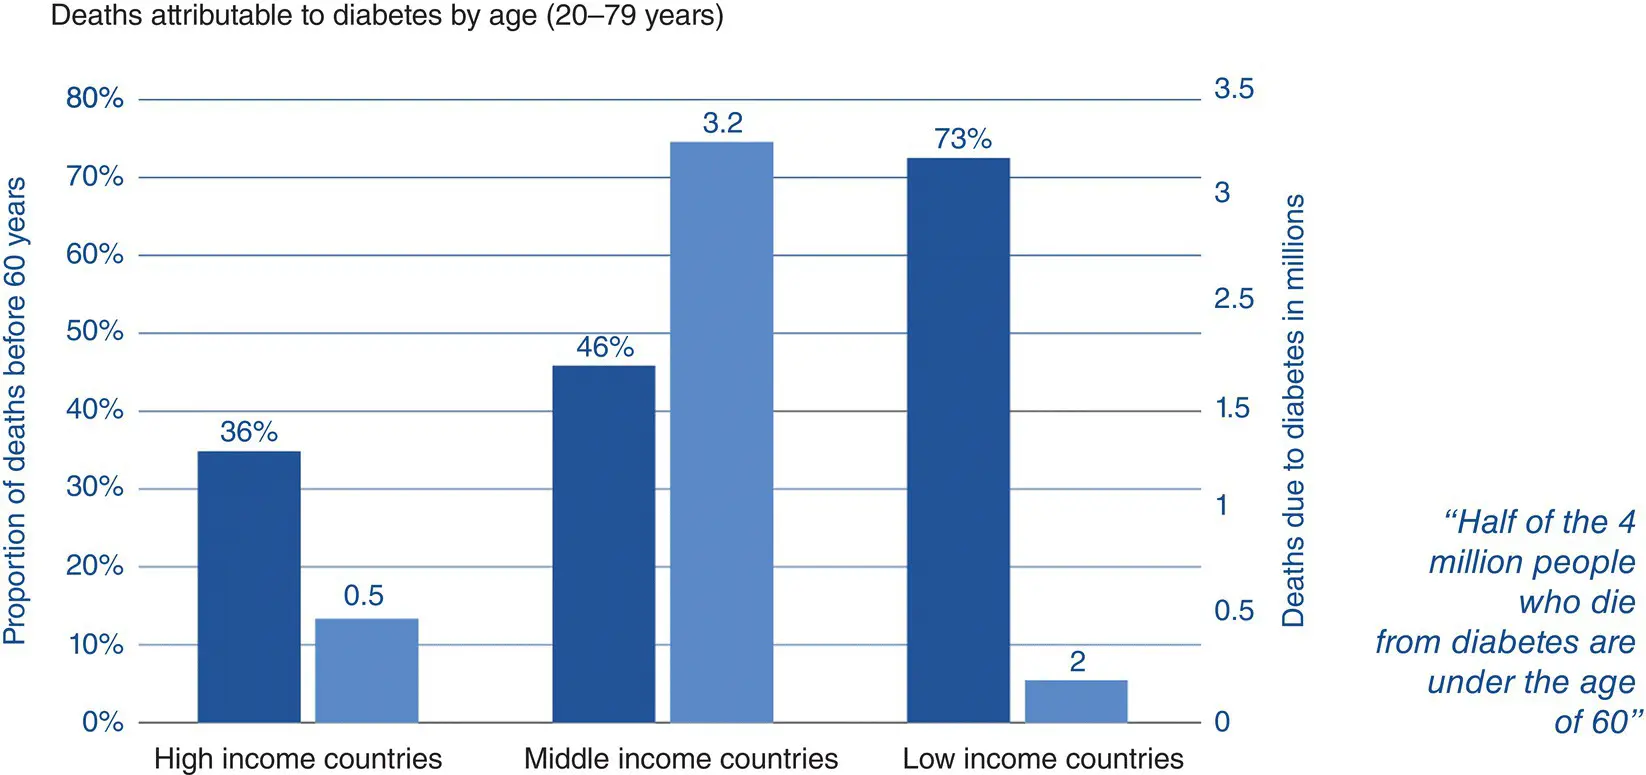
Figure 7.7 Deaths attributable to diabetes are highest in low‐ and middle‐income countries. IDF Diabetes Atlas. © 2017 International Diabetes Federation.
Читать дальшеИнтервал:
Закладка:
Похожие книги на «Handbook of Diabetes»
Представляем Вашему вниманию похожие книги на «Handbook of Diabetes» списком для выбора. Мы отобрали схожую по названию и смыслу литературу в надежде предоставить читателям больше вариантов отыскать новые, интересные, ещё непрочитанные произведения.


Обсуждение, отзывы о книге «Handbook of Diabetes» и просто собственные мнения читателей. Оставьте ваши комментарии, напишите, что Вы думаете о произведении, его смысле или главных героях. Укажите что конкретно понравилось, а что нет, и почему Вы так считаете.