Machine Learning for Healthcare Applications
Здесь есть возможность читать онлайн «Machine Learning for Healthcare Applications» — ознакомительный отрывок электронной книги совершенно бесплатно, а после прочтения отрывка купить полную версию. В некоторых случаях можно слушать аудио, скачать через торрент в формате fb2 и присутствует краткое содержание. Жанр: unrecognised, на английском языке. Описание произведения, (предисловие) а так же отзывы посетителей доступны на портале библиотеки ЛибКат.
- Название:Machine Learning for Healthcare Applications
- Автор:
- Жанр:
- Год:неизвестен
- ISBN:нет данных
- Рейтинг книги:5 / 5. Голосов: 1
-
Избранное:Добавить в избранное
- Отзывы:
-
Ваша оценка:
Machine Learning for Healthcare Applications: краткое содержание, описание и аннотация
Предлагаем к чтению аннотацию, описание, краткое содержание или предисловие (зависит от того, что написал сам автор книги «Machine Learning for Healthcare Applications»). Если вы не нашли необходимую информацию о книге — напишите в комментариях, мы постараемся отыскать её.
Since this book is intended to be useful to a wide audience, students, researchers and scientists from both academia and industry may all benefit from this material. It contains a comprehensive description of issues for healthcare data management and an overview of existing systems, making it appropriate for introductory and instructional purposes. Prerequisites are minimal; the readers are expected to have basic knowledge of machine learning.
This book is divided into 22 real-time innovative chapters which provide a variety of application examples in different domains. These chapters illustrate why traditional approaches often fail to meet customers’ needs. The presented approaches provide a comprehensive overview of current technology. Each of these chapters, which are written by the main inventors of the presented systems, specifies requirements and provides a description of both the chosen approach and its implementation. Because of the self-contained nature of these chapters, they may be read in any order. Each of the chapters use various technical terms which involve expertise in machine learning and computer science.
Machine Learning for Healthcare Applications — читать онлайн ознакомительный отрывок
Ниже представлен текст книги, разбитый по страницам. Система сохранения места последней прочитанной страницы, позволяет с удобством читать онлайн бесплатно книгу «Machine Learning for Healthcare Applications», без необходимости каждый раз заново искать на чём Вы остановились. Поставьте закладку, и сможете в любой момент перейти на страницу, на которой закончили чтение.
Интервал:
Закладка:
In previous works we have seen that theta (4–8 Hz) is preferably explored for finding judgement tasks, studying the cortical activity in left side of brain. We used 4-levels of signal decomposition by Daubechies 4 wavelet technique which results into a group of 5 wavelets coeffs where one group represent one oscillatory signal and presents Neuro-signal pattern through D1–D4 and A4. They have “5 frequency bands—(1–4 Hz), (4–8 Hz), (8–13 Hz), (13–22 Hz) and (32–100 Hz)”.
3.4.2 Dataset Description
We recorded Neuro-signals from 25 participants through 14 channels who all were aged between 18 and 38 years of age belonging to IIT Roorkee. They were shown 39 (13 product types × 3 samples of each product) images. A total of 325 (13 × 25) Neuro-signals were recorded wherein each image was displayed for 4 s. After the collection we asked users to label their choice for each item in terms of Like/Dislike. All participants were instructed to truly evaluate and label correct choices. The following Figures 3.4and 3.5shall provide an overview of the image and dataset.
3.5 Result
3.5.1 Individual Result Analysis
Here, we display the output of the 5 classification algorithms we used on the given dataset for deliberating on Neuromarketing using Machine Learning Algorithms. The output was user-independent as we assume that for predicting the choice of a user his/her training data is not required. In Figure 3.6we depict the overall accuracy received while running it on the mentioned columns, i.e., Decision Tree, Bagging Decision Tree, Gaussian Naïve Bayes Classifier, Kernel SVM and Random Forest Classifier.
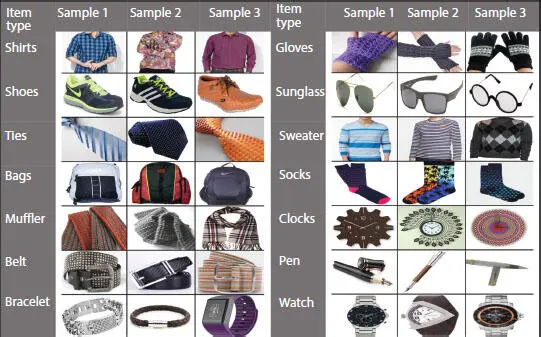
Figure 3.4 Images used for visual evaluation.

Figure 3.5 Sample of EEG signal for a product with corresponding Brain map and choice label.
We compiled all participant’s EEG data into a single file called as “Master file” with appropriate like=1/dislike=0 labelling for all rows. We observe here that Kernel SVM has the highest achieved accuracy followed by Decision Tree whereas all other 3 produce near about close results.
In Figure 3.7, we shall be showing the individual ROC AUC curve results in the graphical form for all the algorithms used on Master file showing true positive and false positive rates by its axes depicting the performance of a classification model at all classification thresholds.

Figure 3.6 Accuracy for all users (compiled).
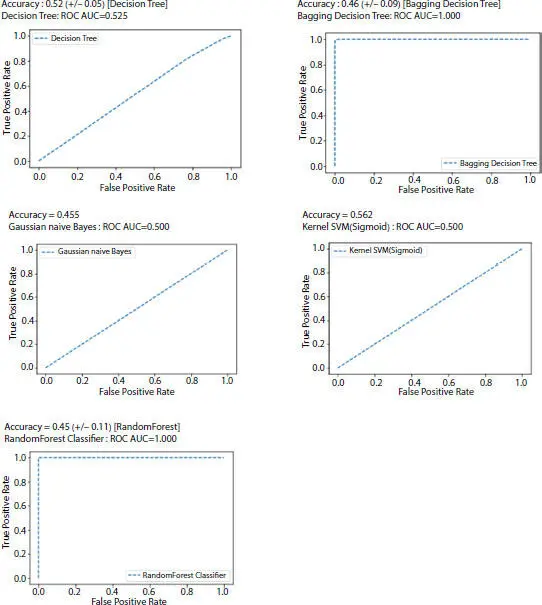
Figure 3.7 Individual result of each algorithm.
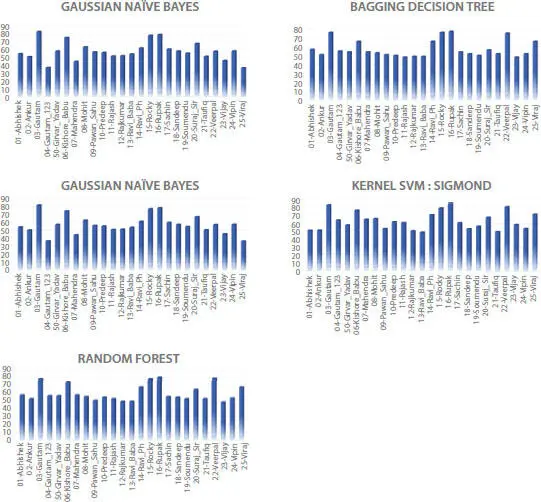
Figure 3.8 Result of 25-users with different algorithms.
In Figure 3.8we shall be showing the individual 25 participant’s resultant accuracy with respect to Decision Tree, Bagging Decision Tree, Gaussian naïve Bayes Classifier, Kernel SVM and Random Forest Classifier in the respective order.
3.5.2 Comparative Results Analysis
In Figure 3.9, we shall be doing a comparative analysis of each user’s data’s performance regarding each individual algorithm in a chart form.
In this study, we applied our knowledge of EEG data and Machine Learning to cohabit in a system for correctly analyze and predict the consumer’s choice when surveying different brands of same type of products. We had 25 males perform this initial study and it resulted in a viable feasibility for developing solutions using EEG data to enhance productivity, cut down on losses and shifting the paradigm of marketing to new heights. We have noticed that on a user-level Kernel SVM has performed better than others in majority of the cases for identifying like/dislike. It has also recorded the highest accuracy in Master file run of 56.2% among others. We have observed that Kernel SVM: Sigmoid is significant to our study and we shall try different kernels in this form to test better results.
In the following Figures 3.10and 3.11we shall be showing you the Approximate Brain’s EEG activity map we have derived for like/dislike states of mind in our Neuromarketing study.
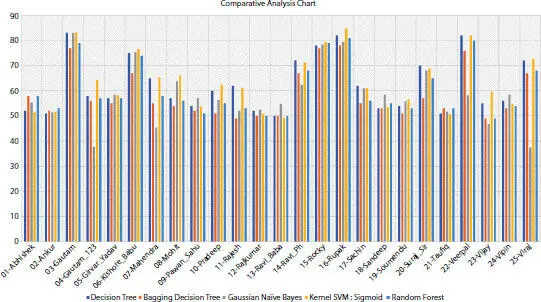
Figure 3.9 Result of 25-users compared with different algorithms.
3.6 Conclusion
In our study we did not achieve high yield of results for now in predicting like/dislike of users as this is a feasibility study based on trials. Thus, we have inferred that we need to use higher complexity models of Deep Learning for achieving better accuracy in near future. We also need to work on a method to tackle fake-responses. We have future plans to provide the participants with a wide variety of choice and more neutral choices to objectively analyze the decision-making process while tracking their eye-movement as an additional parameter while delving deeper into complex classifiers for achieving higher predictions accuracy. We also think that additional methods can be added on to this process like eye-tracking coupled with higher complexity models of classifiers to take our prediction accuracy to a higher level.
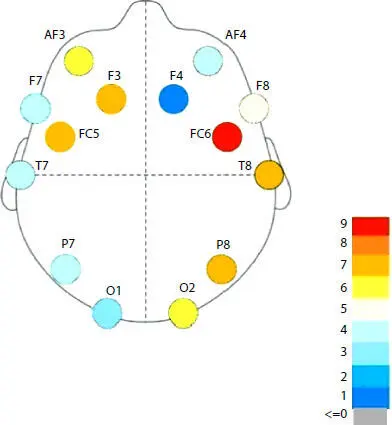
Figure 3.10 Approximate brain EEG map for dislike state.
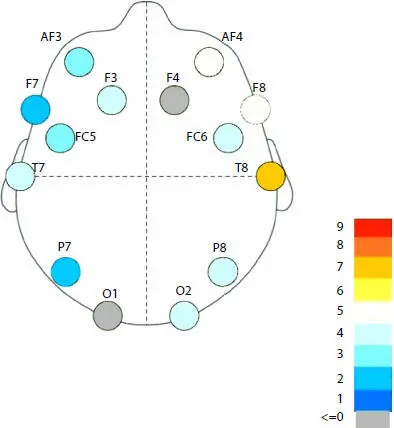
Figure 3.11 Approximate brain EEG map for like state.
References
1. Yadava, M., Kumar, P., Saini, R., Roy, P.P., Dogra, D.P., Analysis of EEG signals and its application to neuromarketing. Multimedia Tools Appl. , 76, 18, 19087–19111, 2017.
2. Tripathi, S., Acharya, S., Sharma, R.D., Mittal, S., Bhattacharya, S., Using Deep and Convolutional Neural Networks for Accurate Emotion Classification on DEAP Dataset. Twenty-ninth IAAI conference , pp. 4746–4752, 2017.
3. Djamal, E.C. and Lodaya, P., EEG based emotion monitoring using wavelet and learning vector quantization. 2017 4th international conference on Electrical Engineering, Computer Science and Informatics (EECSI) , pp. 1–6, IEEE, 2017.
4. Al-Nafjan, A., Hosny, M., Al-Wabil, A., Al-Ohali, Y., Classification of human emotions from electroencephalogram (EEG) signal using deep neural networ. Int. J. Adv. Comput. Sci. Appl , 8, 9, 419–425, 2017.
5. Tseng, K.C., Lin, B.S., Han, C.M., Wang, P.S., Emotion recognition of EEG underlying favourite music by support vector machine. 2013 1st International Conference on Orange Technologies (ICOT) , pp. 155–158, IEEE, 2013.
Читать дальшеИнтервал:
Закладка:
Похожие книги на «Machine Learning for Healthcare Applications»
Представляем Вашему вниманию похожие книги на «Machine Learning for Healthcare Applications» списком для выбора. Мы отобрали схожую по названию и смыслу литературу в надежде предоставить читателям больше вариантов отыскать новые, интересные, ещё непрочитанные произведения.


Обсуждение, отзывы о книге «Machine Learning for Healthcare Applications» и просто собственные мнения читателей. Оставьте ваши комментарии, напишите, что Вы думаете о произведении, его смысле или главных героях. Укажите что конкретно понравилось, а что нет, и почему Вы так считаете.