The isotropic average of Eq. (1.14)leads, via Eq. (1.12), to
(1.15) 
Here, D maxis the maximum dimension of a particle (maximum distance from the geometric centre).
In terms of the isotropically averaged autocorrelation function γ ( r ) this can be written as
(1.16) 
Or in terms of the Debye correlation function Γ( r ):
(1.17) 
This then leads to the expression
( 1.18) 
Here p ( r ) = Γ( r ) r 2is the pair distance distribution function (PDDF). This is an important quantity in SAS data analysis since as can be seen from Eq. (1.18), it is related to the intensity via an indirect Fourier transform:
(1.19) 
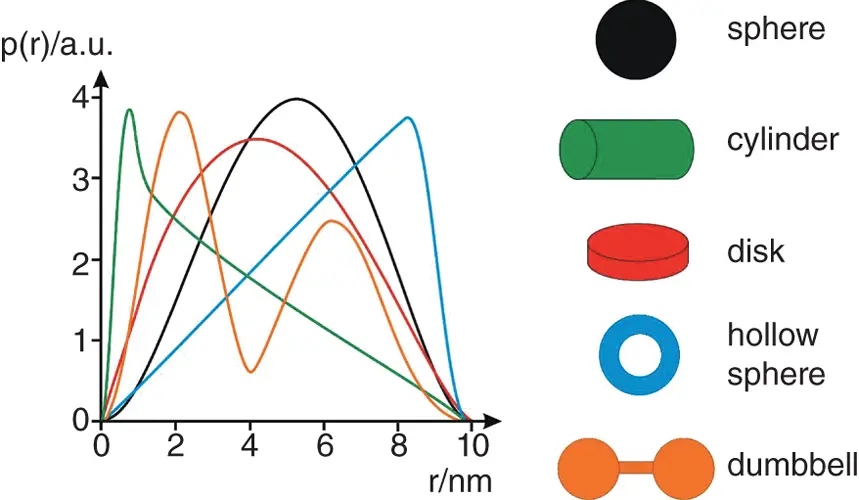
The PDDF provides information on the shape of particles, as well as their maximum dimension D max. Figure 1.3compares the PDDF of different shaped objects.

Figure 1.3 Sketches of pair distance distribution functions for the colour‐coded particle shapes shown with a D max= 10 nm.
Source : Adapted from Ref. [9].
Many SAS data analysis software packages such as ATSAS and others (Table 2.2) and software on synchrotron beamlines is able to compute PDDFs from measured data. Methods to obtain PDDFs by indirect Fourier transform methods are discussed further in Section 4.6.1.
The radius of gyration can be obtained from p ( r ) via the second moment [4, 7, 10, 11]:
( 1.20) 
1.4 GUINIER APPROXIMATION
The Guinier equation is used to obtain the radius of gyration from a simple analysis of the scattering at very low q (from the first part of the measured SAS intensity profile). The Guinier approximation can be obtained from Eq. (1.18), substituting the expansion [6, 7, 11]:
(1.21) 
gives at sufficiently low q (such that the expansion can be truncated at the second term)
(1.22) 
Considering the expression for the radius of gyration as the second moment of p ( r ) ( Eq. (1.20)) we obtain [6, 11, 12]
( 1.23) 
Using the series expansion  with
with  , and truncating at the second term (valid if q is small), this can be rewritten as an exponential
( 1.24) 
This is the Guinier equation. A Guinier plot of ln I ( q ) vs q 2has slope  at low q . Figure 2.8 shows representative Guinier plots. The Guinier equation ( Eq. (1.23)) can also be obtained starting from Eq. (1.10), using the same series expansion for the exponential exp[− i q. r].
For a homogeneous sphere of radius R , the radius of gyration is given by  [6, 11] whereas for a homogeneous infinite cylinder of radius R it is given by
  and for a thin disc of thickness T ,
  [6, 7, 10, 13]. For an ellipse with semiaxes a and b ,
  . For a rod of length L with finite cross‐section the overall radius of gyration, Rg , is related to that of the cross‐section Rc via the expression [7, 11, 12, 14]:
( 1.25) 
The Guinier approximation is useful for systems containing non‐interacting particles (i.e. the structure factor S ( q ) = 1, see Section 1.5) and is typically valid for q < 1/ Rg .
1.5 FORM AND STRUCTURE FACTORS
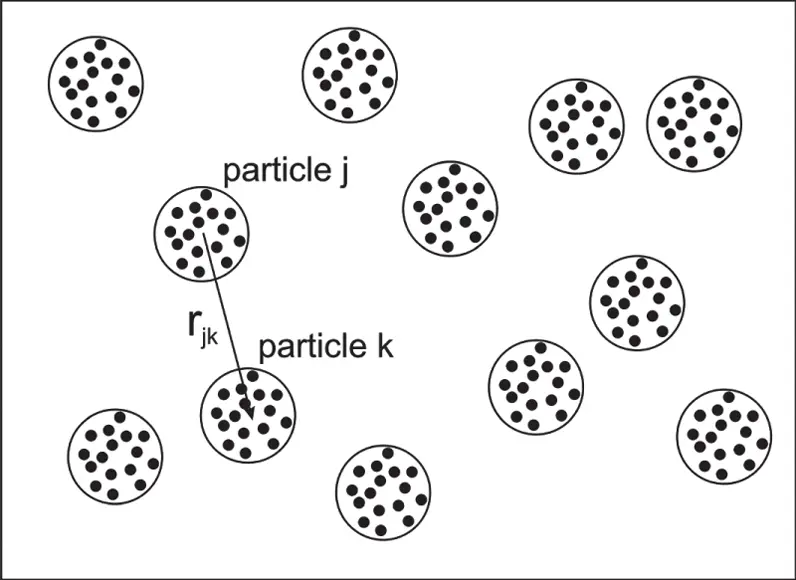
The total intensity scattered by an ensemble of particles (self‐assembled structures, surfactant or polymer assemblies, colloids, etc.) can be separated into terms depending on intra‐particle and inter‐particle terms ( Figure 1.4), which are termed the form factor and structure factor , respectively.

Figure 1.4 Scattering within particles (from atoms/components shown as black dots) corresponds to form factor while scattering between particles (separated by vector r jk) corresponds to structure factor.
For a monodisperse system of spherically symmetric particles (number density np = N / V ), the scattering can be written as
( 1.26) 
Читать дальше


 with
with  , and truncating at the second term (valid if q is small), this can be rewritten as an exponential
 at low q . Figure 2.8 shows representative Guinier plots. The Guinier equation ( Eq. (1.23)) can also be obtained starting from Eq. (1.10), using the same series expansion for the exponential exp[− i q. r].
 [6, 11] whereas for a homogeneous infinite cylinder of radius R it is given by
  and for a thin disc of thickness T ,
  [6, 7, 10, 13]. For an ellipse with semiaxes a and b ,
  . For a rod of length L with finite cross‐section the overall radius of gyration, Rg , is related to that of the cross‐section Rc via the expression [7, 11, 12, 14]:


