Modern Trends in Structural and Solid Mechanics 1
Здесь есть возможность читать онлайн «Modern Trends in Structural and Solid Mechanics 1» — ознакомительный отрывок электронной книги совершенно бесплатно, а после прочтения отрывка купить полную версию. В некоторых случаях можно слушать аудио, скачать через торрент в формате fb2 и присутствует краткое содержание. Жанр: unrecognised, на английском языке. Описание произведения, (предисловие) а так же отзывы посетителей доступны на портале библиотеки ЛибКат.
- Название:Modern Trends in Structural and Solid Mechanics 1
- Автор:
- Жанр:
- Год:неизвестен
- ISBN:нет данных
- Рейтинг книги:4 / 5. Голосов: 1
-
Избранное:Добавить в избранное
- Отзывы:
-
Ваша оценка:
Modern Trends in Structural and Solid Mechanics 1: краткое содержание, описание и аннотация
Предлагаем к чтению аннотацию, описание, краткое содержание или предисловие (зависит от того, что написал сам автор книги «Modern Trends in Structural and Solid Mechanics 1»). Если вы не нашли необходимую информацию о книге — напишите в комментариях, мы постараемся отыскать её.
Modern Trends in Structural and Solid Mechanics 1 — читать онлайн ознакомительный отрывок
Ниже представлен текст книги, разбитый по страницам. Система сохранения места последней прочитанной страницы, позволяет с удобством читать онлайн бесплатно книгу «Modern Trends in Structural and Solid Mechanics 1», без необходимости каждый раз заново искать на чём Вы остановились. Поставьте закладку, и сможете в любой момент перейти на страницу, на которой закончили чтение.
Интервал:
Закладка:
applied only on the top surface. The material of the layers has the following values of the moduli:
[1.13] 
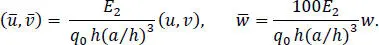
Here, E , G and ν denote Young’s modulus, shear modulus and Poisson’s ratio, respectively, and subscripts L and T indicate directions parallel and transverse to the fiber direction. Following Pagano, we express the results in terms of the non-dimensionalized quantities defined in equation [1.4]and employ (x, y, z) = (x 1, x 2, x 3) as the coordinate axes and (u, v, w) = (u 1, u 2, u 3)
[1.14] 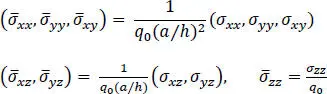
In Table 1.1, we compare our results of select quantities with those in Pagano (1969) for the plate aspect ratio a/h = 100, 10, 4 and 2. It is clear that the developed least-squares method algorithm yields highly accurate results for the simply supported laminate.
Table 1.1. Comparison of the results with the 3D exact solution of Pagano for the [0/90/90/0] laminate
| a/h | - |  |
 |
 |
 |
 |
 |
|---|---|---|---|---|---|---|---|
| 2 | Pagano | 1.38841-0.91165 | 0.83508-0.79465 | -0.086300.06732 | 0.15300 | 0.29458 | 5.0745 |
| Present | 1.38020 -0.90607 | 0.83038-0.79049 | -0.085990.06711 | 0.15311 | 0.29428 | 5.0643 | |
| 4 | Pagano | 0.72026-0.68434 | 0.66255 -0.66551 | -0.046660.04581 | 0.21933 | 0.29152 | 1.93672 |
| Present | 0.72020-0.68427 | 0.66246-0.66541 | -0.046650.04575 | 0.21939 | 0.29154 | 1.93660 | |
| 10 | Pagano | 0.55861-0.55909 | 0.40095-0.40257 | -0.027500.02764 | 0.30137 | 0.19595 | 0.73698 |
| Present | 0.55862-0.55910 | 0.40096-0.40257 | -0.027470.02761 | 0.30140 | 0.19597 | 0.73698 | |
| 100 | Pagano | 0.53885-0.53887 | 0.27101-0.27103 | -0.021350.02136 | 0.33880 | 0.13894 | 0.43460 |
| Present | 0.53883-0.53885 | 0.27100-0.27102 | 0.021353-0.021355 | 0.33880 | 0.13894 | 0.43460 |
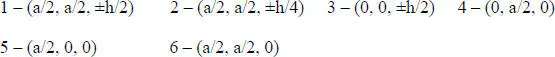
For a/h = 100, the maximum error in the computed quantities equals 0.023% for the in-plane shear stress at point (0, 0, − h /2), and for a/h = 2, the maximum error is 0.612% for the in-plane axial stress at point ( a /2, a /2, − h /2). The errors for a/h = 10 and 4 are between those for a/h = 100 and 2. The through-the-thickness plots of  ,
,  ,
,  ,
,  and
and  coincide well with those from Pagano’s solution and are omitted.
For a/h = 10 and 2, we conducted the following five numerical experiments, E 1, E 2, …, E 5, by varying N 1, N 2and N 3. In E 1and E 2, N 3was set equal to either 3 or 4 and N 1= N 2was assigned values 4, 6 and 8; in E 3and E 4, N 1= N 2= 4 and N 3was given values 3, 4, 6 and 8; and in E 5, N 1= N 2= N 3were assigned values 4, 6 and 8. Thus, a total of 13 combinations of N 1, N 2and N 3were evaluated for each value of a/h, and values of u, v, w, σxx , σyy , σxy and σxz at typical points were compared with their analytical values. For a/h = 10, N 1= N 2= 8, N 3= 3 (total degrees of freedom (DOFs) = 9,477) provided an error of less than 0.1% in the value of each of these seven variables. Keeping N 1= N 2= 8 and increasing N 3= 4, 5 marginally decreased the error, suggesting that there is no benefit derived from the increased computation cost. For a/h = 4, all 13 combinations of values of N 1, N 2and N 3resulted in an error of 7.25% in w and the error in σxz decreased from 37.7% for N 1=N 2=N 3= 4 to 0.03% for N 1= N 2= N 3= 8 (DOFs = 24,057).
1.3.2. Simply supported sandwich plate
We now study deformations of a sandwich plate with the top and bottom facesheets made of an orthotropic Aragonite crystal and the core made of a softer material. Material properties of the facesheets and the core are the same as those in Srinivas and Rao (1970). The top surface of the plate is loaded by sinusoidal tractions given by equation [1.12]and the bottom surface is traction-free. Since the load on the top surface given by equation [1.12]is different from that in Srinivas and Rao (1970), we first solved the problem analytically using their methodology, then verified our software by ensuring that values of displacements and stresses at several points agreed with those reported in Srinivas and Rao (1970). The thickness of each facesheet equals 0.1h and that of the core 0.8h, where h equals the sandwich plate thickness.
Defining β = E x1/E x2,where E x1and E x2are, respectively, elastic moduli of the facesheets and the core in the x direction, we compare the results from the least-squares method and the analytical solution for β = 1, 10, 100, 1000, 10,000, and aspect ratio a/h = 10, 5 and 2 in Tables 1.2– 1.4. Quantities compared are the centroidal deflection, stresses σxx , σyy and σxz , normalized as wE x2/q 0, σ xx/q 0, σ yy/q 0and σ xz/q 0. Note that z = 0.4h +and 0.4h -, respectively, represent interfaces between the top facesheet and the core. For the three aspect ratios and for all values of β except β = 10,000, the least-squares methodology gives results that differ from their analytical values by less than 0.4%. Even for β = 10,000, the maximum error in all quantities is less than 1.3%, except for that in σ xz. Thus, we should not use the least-squares method for β = 10,000. We have not investigated if increasing values of N 1, N 2and N 3in equation [1.9]will reduce this error.
Читать дальшеИнтервал:
Закладка:
Похожие книги на «Modern Trends in Structural and Solid Mechanics 1»
Представляем Вашему вниманию похожие книги на «Modern Trends in Structural and Solid Mechanics 1» списком для выбора. Мы отобрали схожую по названию и смыслу литературу в надежде предоставить читателям больше вариантов отыскать новые, интересные, ещё непрочитанные произведения.


Обсуждение, отзывы о книге «Modern Trends in Structural and Solid Mechanics 1» и просто собственные мнения читателей. Оставьте ваши комментарии, напишите, что Вы думаете о произведении, его смысле или главных героях. Укажите что конкретно понравилось, а что нет, и почему Вы так считаете.