Drought detection requires observation of a plethora of different climatic and biophysical variables. Observations in situ, however, do not provide a uniform spatial distribution and are limited to populated areas, hence satellite‐based observations provide a unique way to analyze and monitor drought at a global scale. Satellites offer observations for a wide range of climate variables such as precipitation, soil moisture, temperature, relative humidity, evapotranspiration, vegetation greenness, land‐cover condition, and water storage (Aghakouchak, Farahmand, et al., 2015; R. G. Allen et al., 2007; L. Wang & Qu, 2009; Whitcraft et al., 2015). Although remote sensing provides more opportunities for the scientific community to monitor Earth systems and offer better understanding of drought impact at regional to global scales, it is not without flaws or challenges. The main challenge is the insufficient length of the observed records provided for the variables of interest. Other challenges include data consistency, ease of access, quantifying uncertainty, and development of appropriate drought indices, which will be discussed throughout this chapter.
1.2. PROGRESS IN REMOTE SENSING OF DRIVERS OF DROUGHT
This section presents the recent remote sensing techniques used for identification and quantification of drought as characterized by different climatic and biophysical variables.
A meteorological drought can be described as precipitation deficiency over a period of time (WMO, 1975), often represented in terms of an index of deviation from normal. Drought indices not only serve the scientific communities but they are also great tools for facilitating the decision‐making and policy‐making processes for stakeholders and managers when compared with the raw data. One of the most widely used and informative meteorological drought indices is the standardized precipitation index (SPI) developed by Mckee et al. (1993). Several other meteorological drought indices have also been proposed, including, but not limited to, precipitation effectiveness (Thornthwaite, 1931), antecedent precipitation (API; McQuigg, 1954), rainfall anomaly (RAI; Van Rooy, 1965), drought area (Bhalme & Mooley, 1980), effective precipitation (Byun & Wilhite, 1999), and rainfall variability indices (Oguntunde et al., 2011). The SPI is currently being used in many national operational and research centers and was recognized as a global measure to characterize meteorological drought by the World Meteorological Organization (WMO, 2009). Computation of SPI requires measured rainfall data and a normalization process of monthly data, either by utilizing an appropriate probability distribution function (PDF) to transform the rainfall PDF (e.g., gamma or Pearson type III probability distribution) into a standard normal distribution (Khalili et al., 2011), or by utilizing a nonparametric approach (Hao & AghaKouchak, 2014). Precipitation deficit can be specified for different timescales (e.g., from 1 to 24 months) when using SPI, where precipitation abnormalities in shorter timescales reflect soil moisture wet/dry conditions and longer timescales portray the wet/dry conditions of subsequent processes such as streamflow, reservoir levels, and ultimately groundwater.
Since the root cause of droughts is deficit in precipitation, meteorological drought indices, and in particular SPI, are suitable indices for revealing the onset of drought (Hao & Aghakouchak, 2013). Indeed, precipitation is regarded as a key component in drought analysis. Clustering approaches have been used as a common practice to identify spatially homogeneous drought areas by utilizing meteorological drought indices such as SPI (Santos et al., 2010). Assessment of temporal variability of metrological drought utilizing SPI, however, has shown formation of noncoherent clusters in spatiotemporal clustering (Modaresi Rad & Khalili, 2015). This is due to precipitation’s large spatial variability, which creates diverse spatial patterns even at small scales. Considering spatial variability of precipitation is crucial, since a dense and evenly distributed network of gauging stations is required for describing spatiotemporal characteristics of drought. Similarly, ground‐based weather radars also suffer from spatial discontinuity and are error prone due to contamination by surface backscatter, uncertainty of approximation of relation between reflectivity and rain rate, and bright band effects, making them unfeasible for global applications (Kidd et al., 2012; Wolff & Fisher, 2008). As a result, a more robust approach would be to use satellite observations that would produce gridded data as an input not only for drought models, but also for meteorological and hydrological models such as weather research and forecasting (WRF) and variable infiltration capacity (VIC).
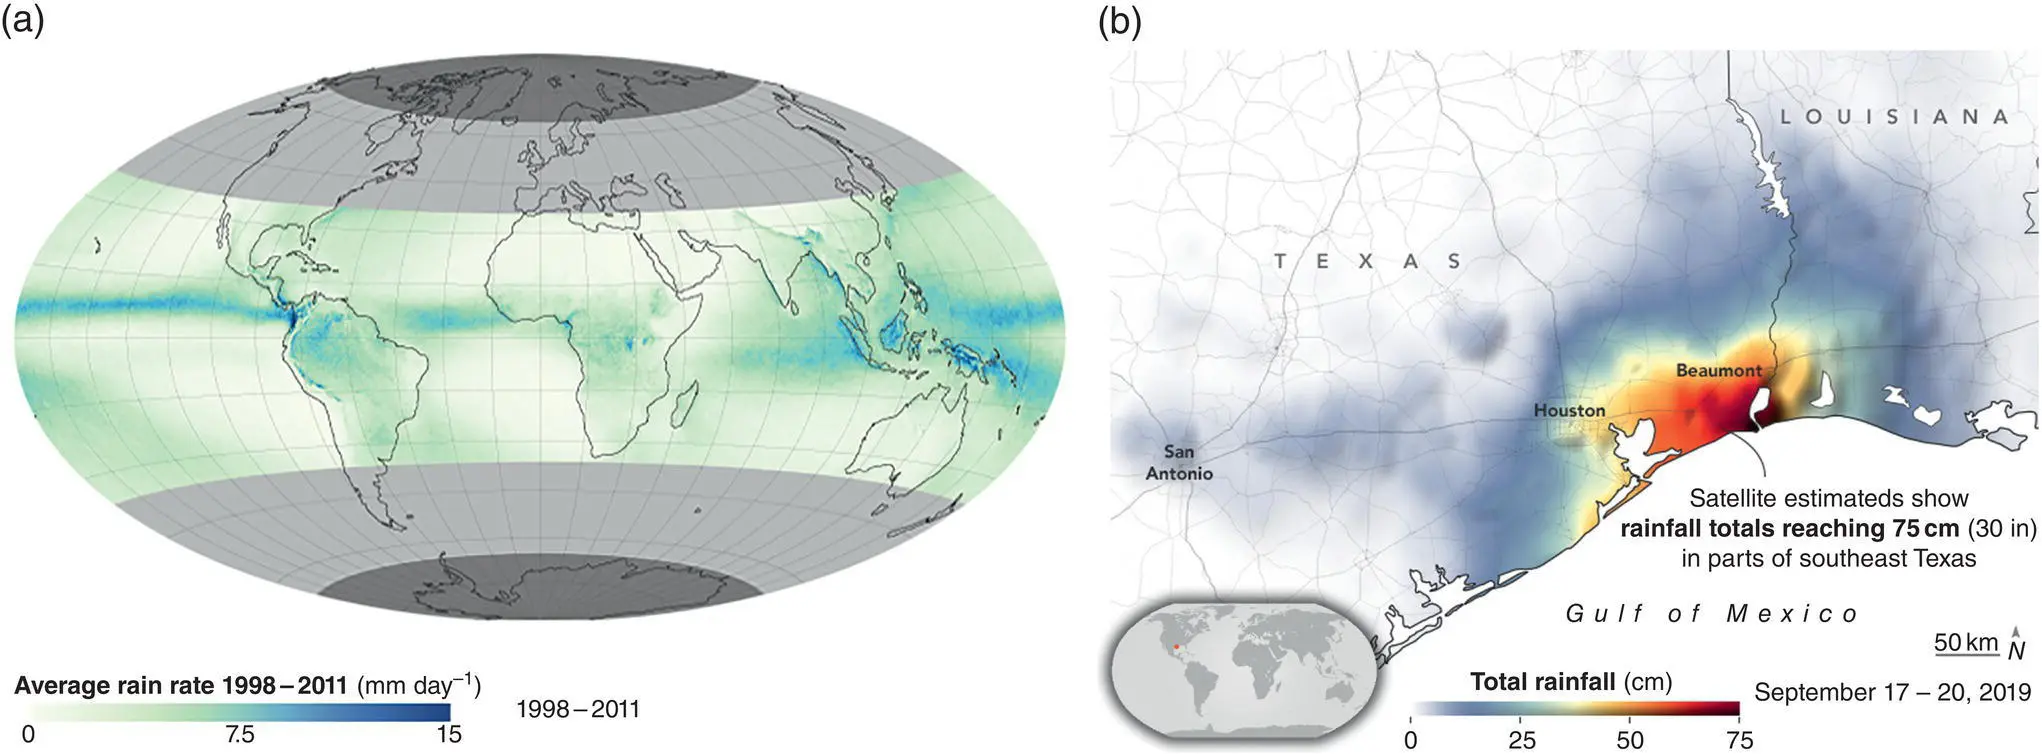
Figure 1.1 Rainfall map by NASA’s Tropical Rainfall Measuring Mission (TRMM) satellite. (a) Average rate of rainfall per day for the period of 1998‐2011. (b) A tropical storm in southeast Texas causing record‐breaking floods, produced using the IMERG precipitation product.
(Courtesy: NASA’s Earth observatory: https://earthobservatory.nasa.gov/images)
Visible (VIS) satellite images provide information about cloud thickness and infrared (IR) images provide information on cloud top temperature and cloud height that are used to estimate precipitation rate via different retrieval algorithms (Joyce & Arkin, 1997; Sapiano & Arkin, 2009; Turk et al., 1999). Geostationary (GEO) VIS/IR satellites offer approximately a 15–30 min frequency of observations, but their accuracies are disputed. On the other hand, passive microwave (MW) sensors capture data of hydrometeor signals and scattering signals of raindrops, snow, and ice contents in the lower atmosphere and sense the bulk emission from liquid water, and therefore provide a more accurate estimation of precipitation rate (Behrangi et al., 2014). The MW sensors, however, often face difficulties distinguishing between light rain and clouds and have less frequent overpass (almost two observations per a day). Therefore, it is suggested that a combination of both MW and VIS/IR satellite observations can result in more accurate estimations (Joyce et al., 2004). Currently, a variety of precipitation satellite data sets or products exist, amongst which that of the Tropical Rainfall Measuring Mission (TRMM) has found notable success towards improving the forecast of extreme events ( Figure 1.1a). This data set is a joint mission between the National Aeronautics and Space Administration (NASA) and the Japan Aerospace Exploration Agency (JAXA) that advances the understanding of tropical rainfalls over the ocean by providing three‐dimensional images. The mission was launched in 1997 and terminated in 2015, and the project was continued in 2014 by NASA's Goddard Space Flight Center and JAXA as Global Precipitation Measurement (GPM), with a new calibration standard for the rest of the satellite constellation and a core observatory that possessed a Dual‐frequency Precipitation Radar (DPR) and a GPM Microwave Imager (GMI) (Hou et al., 2014). Other satellite precipitation data sets include the Climate Predicting Center (CPC) Morphing Technique (CMORPH; Joyce et al., 2004), CPC Merged Analysis of Precipitation (CMAP; Xie & Arkin, 1997), TRMM Multisatellite Precipitation Analysis (TMPA; Huffman et al., 2007), Special Sensor Microwave Imager (SSM/I; Ferraro, 1997), Global Precipitation Climatology Project (GPCP; Adler et al., 2003), Precipitation Estimation from Remotely Sensed Information using Artificial Neural Networks (PERSIANN; Figure 1.2; Ashouri et al., 2015; Hsu et al., 1997; S. Sorooshian et al., 2000), and the new GPM mission known as the Integrated MultisatellitE Retrievals for GPM (IMERG; Figure 1.1b; Huffman et al., 2015).
Читать дальше
