Global Drought and Flood
Здесь есть возможность читать онлайн «Global Drought and Flood» — ознакомительный отрывок электронной книги совершенно бесплатно, а после прочтения отрывка купить полную версию. В некоторых случаях можно слушать аудио, скачать через торрент в формате fb2 и присутствует краткое содержание. Жанр: unrecognised, на английском языке. Описание произведения, (предисловие) а так же отзывы посетителей доступны на портале библиотеки ЛибКат.
- Название:Global Drought and Flood
- Автор:
- Жанр:
- Год:неизвестен
- ISBN:нет данных
- Рейтинг книги:5 / 5. Голосов: 1
-
Избранное:Добавить в избранное
- Отзывы:
-
Ваша оценка:
Global Drought and Flood: краткое содержание, описание и аннотация
Предлагаем к чтению аннотацию, описание, краткое содержание или предисловие (зависит от того, что написал сам автор книги «Global Drought and Flood»). Если вы не нашли необходимую информацию о книге — напишите в комментариях, мы постараемся отыскать её.
Global Drought and Flood: Observation, Modeling, and Prediction Volume highlights include:
Remote sensing approaches for mapping droughts and floods Physical and statistical models for monitoring and forecasting hydrologic hazards Features of various drought and flood systems and products Use by governments, humanitarian, and development stakeholders in recent disaster cases Improving the collaboration between hazard information provision and end users The American Geophysical Union promotes discovery in Earth and space science for the benefit of humanity. Its publications disseminate scientific knowledge and provide resources for researchers, students, and professionals.
Global Drought and Flood — читать онлайн ознакомительный отрывок
Ниже представлен текст книги, разбитый по страницам. Система сохранения места последней прочитанной страницы, позволяет с удобством читать онлайн бесплатно книгу «Global Drought and Flood», без необходимости каждый раз заново искать на чём Вы остановились. Поставьте закладку, и сможете в любой момент перейти на страницу, на которой закончили чтение.
Интервал:
Закладка:
Evapotranspiration (ET) is an important variable in agriculture, accurate estimation of which is essential for modeling agricultural drought. Evapotranspiration directly affects socioeconomic systems and agriculture, as irrigation water demand and crop yield are determined by this variable. Ecosystem and agriculture responses to drought are depicted by the ratio between actual ET (AET) and potential ET (PET) (Thornthwaite, 1948). Accordingly, several drought indices have been proposed that incorporate ET into their calculation including the PDSI, Crop Water Stress Index (CWSI; Jackson et al., 1981), Supply–Demand Drought Index (SDDI; Rind et al., 1990), Water Deficit Index (WDI; Moran et al., 1994), Reconnaissance Drought Index (RDI; Tsakiris & Vangelis, 2005), Evaporative Drought Index (EDI; Yao et al., 2010), Standardized Precipitation Evapotranspiration Index (SPEI; Vicente‐Serrano et al., 2010), Evaporative Stress Index (ESI; M. C. Anderson et al., 2016), Drought Severity Index (DSI; Mu et al., 2013), Green Water Scarcity Index (GWSI; Núñez et al., 2013), Green Water Stress Index (GrWSI; Wada, 2013), Standardized Palmer Drought Index (SPDI; Ma et al., 2014), Multivariate Drought Index (MDI; Rajsekhar et al., 2015), effective Reconnaissance Drought Index (eRDI; Tigkas et al., 2017), Normalized Ecosystem Drought Index (NEDI; Chang et al., 2018), and Aggregate Drought Index (ADI; S. Wang et al., 2018).
Both RDI and SPEI are widely used water‐balance‐system agricultural drought indices that utilize precipitation and PET as their input (Tsakiris et al., 2007; Vicente‐Serrano et al., 2010). While SPEI uses the Penman–Monteith method to derive PET ( Figure 1.6), RDI utilizes temperature‐based methods to estimate PET and can use satellite‐retrieved air temperature data (Dalezios et al., 2012). Recently, Tigkas et al. (2017) modified the RDI index by substituting precipitation by effective precipitation (the amount of water that contributes to crop development and is absorbed by the root system), which can more effectively describe plant water consumption. The modified index (eRDI) has the advantage of considering different stages of crop development and has shown higher correlation to reduction of crop yield in the location studied (Tigkas et al., 2017). Despite the advantages of utilizing the temperature‐based method of PET, it suffers from several shortcomings as other factors such as net radiation, wind speed, and relative humidity that have strong influence on PET are being neglected in the process (Donohue et al., 2010; McVicar et al., 2012). Ma et al. (2014) outlined some issues regarding the climatic water balance system used by SPEI and suggested that SPEI would be more realistic if soil‐moisture‐related hydrometeorological processes are considered. They redefined the procedure of PDSI calculation on the basis of the mathematical framework of SPEI and proposed a new multiscalar drought index. While indices such as SPI or PDSI can be used as early warning systems to detect potential drought imposed on an ecosystem, NEDI offers an actual drought stress response to limited water availability.
The remotely sensed methods of ET estimation can be categorized into four groups, including water balance systems (R. G. Allen et al., 1998; Senay, 2008), surface energy balance systems (R. G. Allen et al., 2007; Anderson & Kustas, 2008), vegetation indices (Glenn et al., 2011), and hybrid approaches that incorporate vegetation indices and surface temperature measurements (Kalma et al., 2008; Yang & Shang, 2013). MODIS data have been frequently used worldwide to obtain land surface temperature data and derive ET for purposes of drought monitoring such as estimation of Evaporative Stress Index (ESI; Figure 1.7; M. C. Anderson et al., 2007) and DSI. Some other satellites capable of measuring land surface temperature include Advanced Spaceborne Thermal Emission and Reflection Radiometer (ASTER) on board Terra, Landsat, AVHRR on board polar orbiting platforms of NOAA, and visible and infrared imager (MVIRI) on board Meteosat satellites. The ECOsystem Spaceborne Thermal Radiometer Experiment on Space Station (ECOSTRESS) is a multiple wavelength imaging spectrometer that was launched on 29 June 2018 to the International Space Station (ISS) that provides ET estimates. This product has a spatial resolution of ~70 m and temporal resolution of approximately 3 days and is variable depending on ISS. Different ECOSTRESS data products are available for download through the United States Geological Survey (USGS) satellite image query tool ( https://earthexplorer.usgs.gov/).
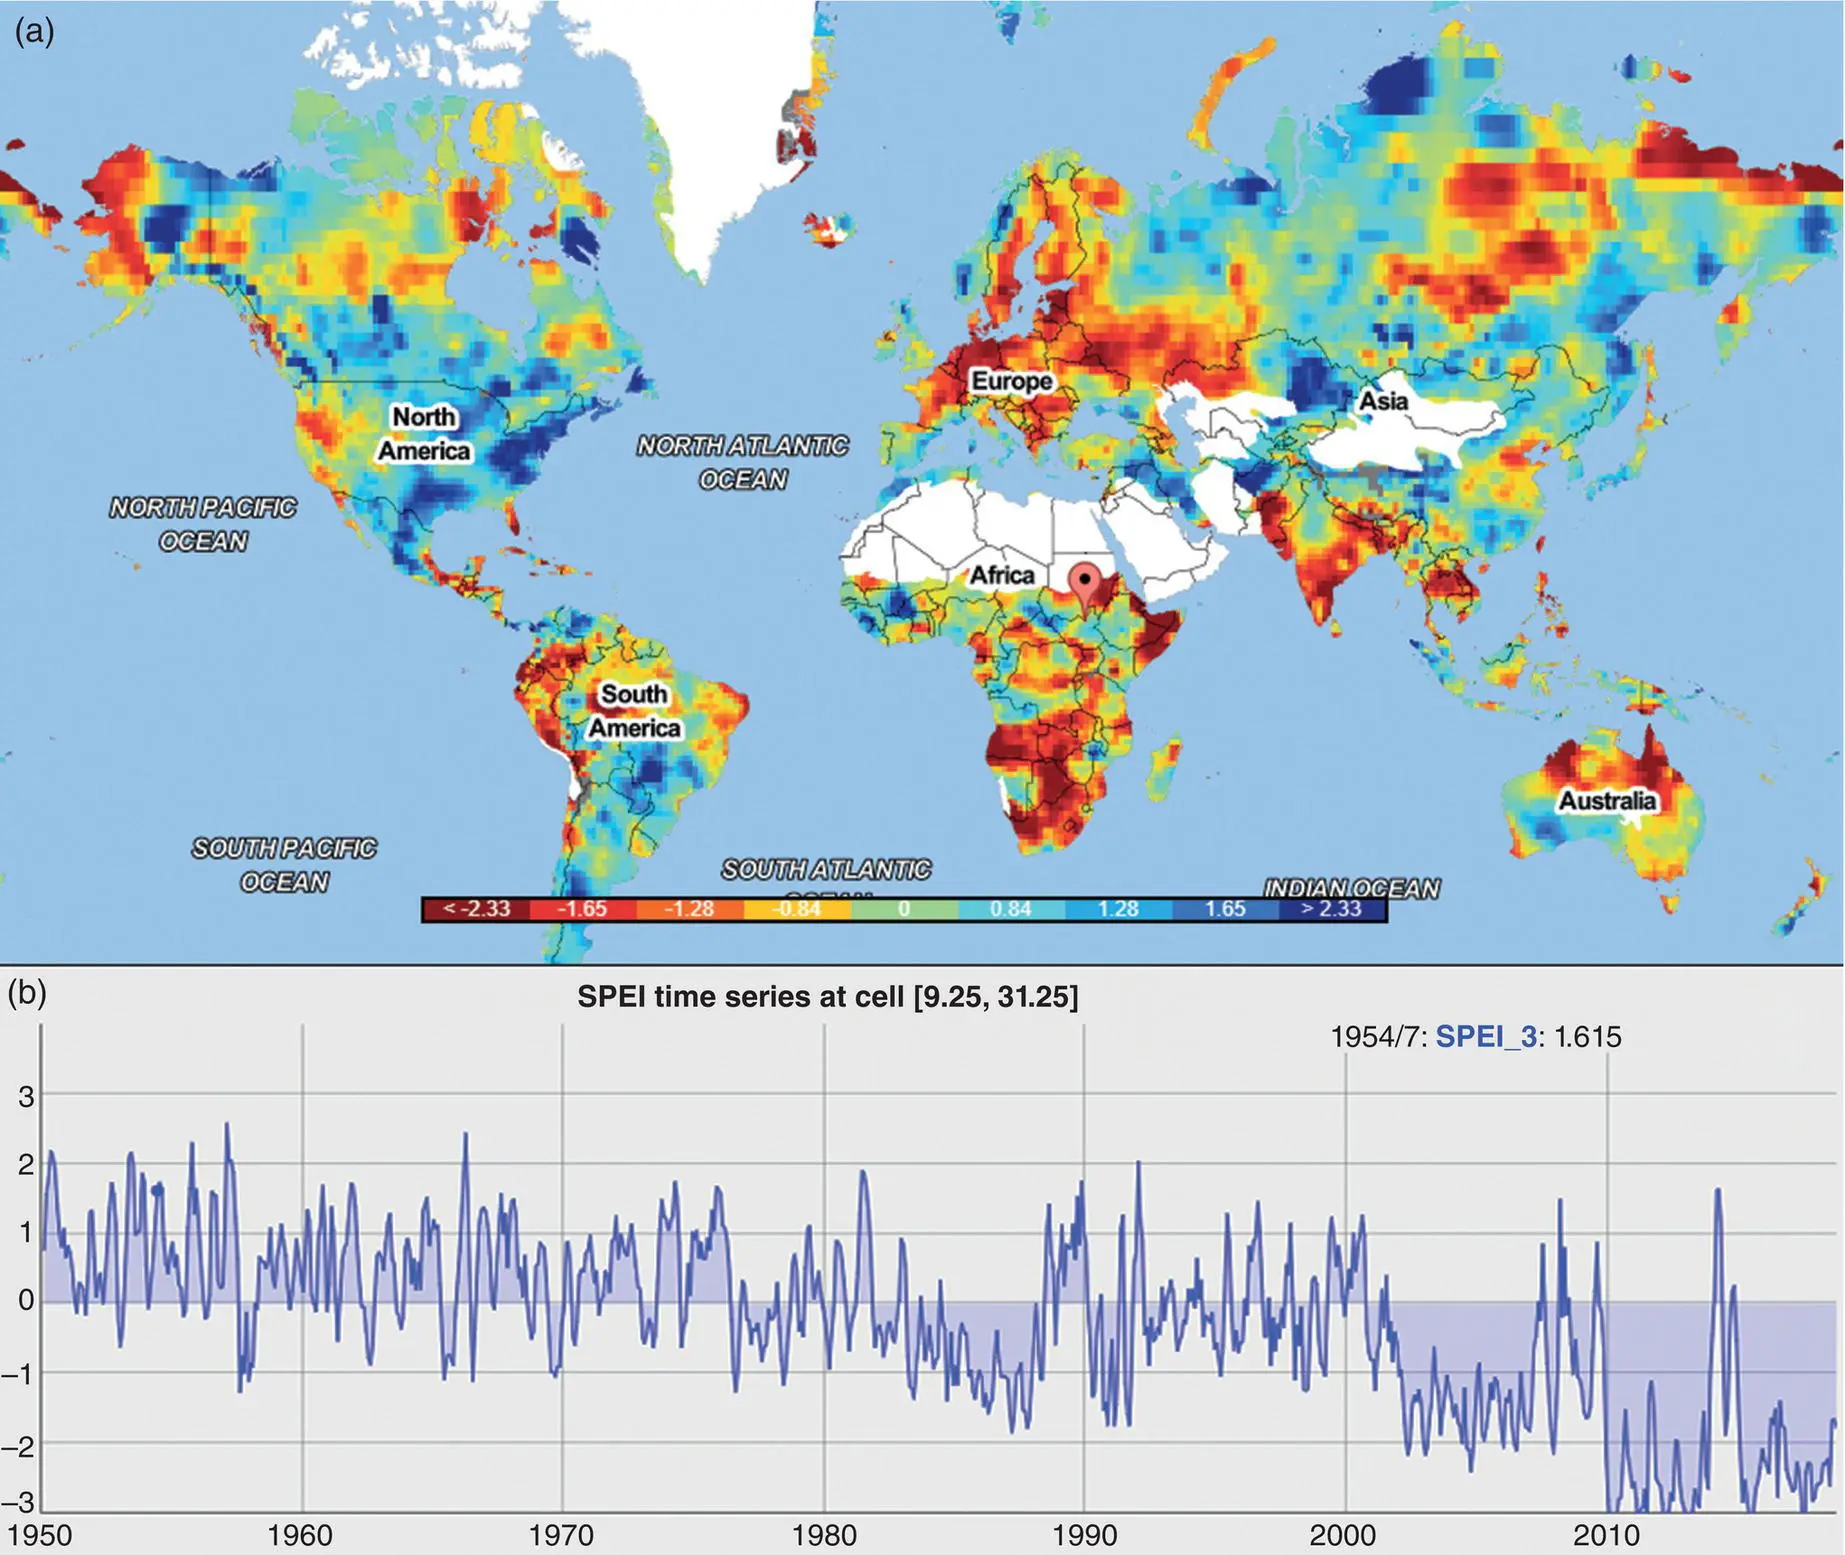
Figure 1.6 Three‐month Standardized Precipitation Evapotranspiration Index (SPEI) with 1° spatial resolution. (a) Global view of SPEI for November 2018. (b) Time series of SPEI for 9.25° E and 31.25° S in Africa.
( Source: The Standardized Precipitation Evapotranspiration Index (SPEI), http://spei.csic.es/map/maps.html)
1.2.5. Snow
Snow and ice are key components of the hydrological cycle. The lack of snow and ice storage in the snow‐dominated regions significantly impacts the availability of water throughout the dry seasons, and influences reservoir operation, flood risk management, recreation, tourism, energy production, navigation, and river ecology (Staudinger et al., 2014). Therefore, snow shortage in snow‐dominated mountain watersheds drives a range of adverse economic and social outcomes. Studies suggest that the occurrence of earlier peak discharge in western United States due to a warmer climate results in increased periods of summer water stress, which can in turn change forest structure (Harpold et al., 2014; Harpold, 2016). The continuous changes in the climate of snow‐dominated watersheds (i.e., less snow, more rain, and earlier snowmelt) motived researchers to introduce the concept of snow drought (Hatchett & McEvoy, 2018). Only a little research has been undertaken, however, with respect to developing a snow‐based indicator of drought. Currently, there is no generally accepted classification scheme for snow droughts. Three key metrics, the peak snow water equivalent (SWE), the date of peak SWE (DPS), and the snow disappearance date (SDD), however, have been used to characterize snow drought in the mountainous watersheds. The concept of snow drought can be defined as below‐average SWE at approximately when the maximum SWE typically occurs (Hatchett & McEvoy, 2018). Different definitions of snow drought have been proposed throughout the literature, including Van Loon and Van Lanen (2012) and Harpold et al. (2017).
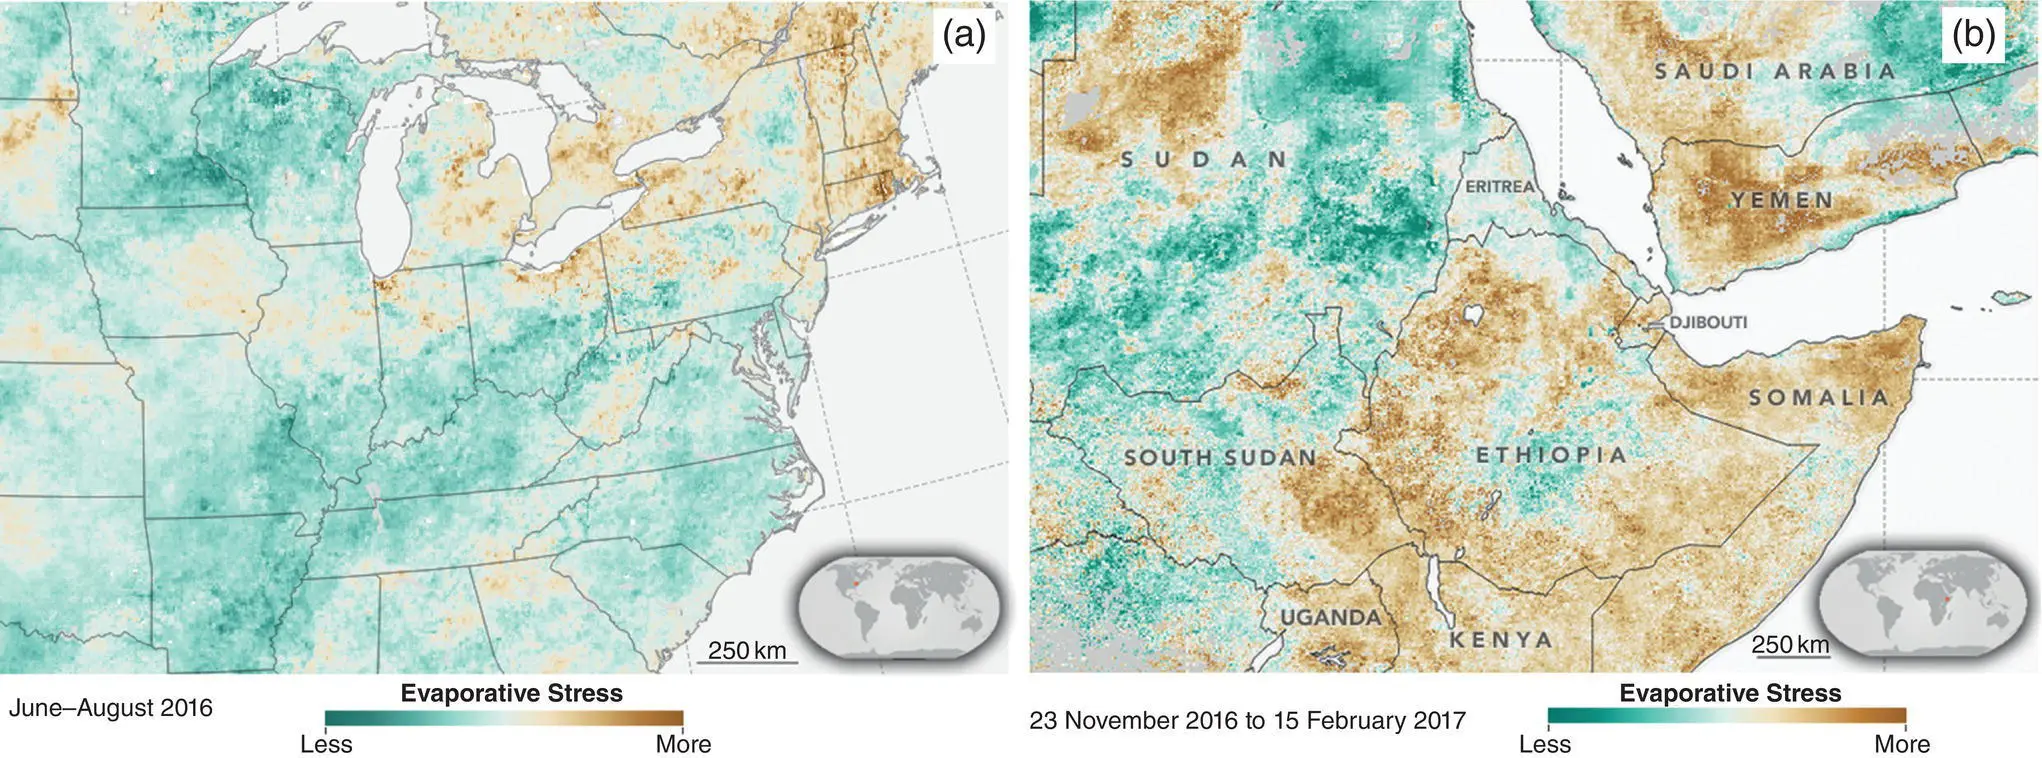
Figure 1.7 Evaporative Stress Index (ESI) derived from observations of land surface temperatures and leaf area index from the Moderate Resolution Imaging Spectroradiometer (MODIS) on NASA’s Terra and Aqua satellites and the Visible Infrared Imaging Radiometer Suite (VIIRS) of the Suomi National Polar‐orbiting Partnership (NPP). (a) The drought in New England that put crops and businesses under stress. (b) The drought that reduced food production and increased famine in the Greater Horn of Africa.
(Courtesy: NASA’s earth observatory: https://earthobservatory.nasa.gov/images)
Van Loon and Van Lanen (2012) described different scenarios of snow related drought according to their development: (a) rain‐to‐snow season drought, (b) cold snow season drought, and (c) warm snow season drought. Rain‐to‐snow season drought is developed due to a shortage of rainfall in the rain season (spring, summer and/or autumn) and ends in snow season (winter) with precipitation being in the form of snow. Consequently, soil moisture, streamflow, and groundwater remain relatively low until the upcoming melt season. Cold snow season drought is a result of abnormally low temperature in the snow season and a possible coincidence with below‐average precipitation that can be categorized into three subtypes of A, B, and C. Subtype A describes climates with continuous snow cover during winter and below zero temperature. Early beginning of the snow season is the main driver of this drought type. Subtype B has the same climate as A, however, delay in snowmelt due to low temperature at the end of winter drives this type of snow drought. Subtype C is climate with a temperature around zero and limited snow accumulation in winter. Snowmelt often provides recharge to groundwater and streamflow during snow season. An abnormal temperature drop in winter results in an intermediate shortage of water for a few weeks to months duration.
Читать дальшеИнтервал:
Закладка:
Похожие книги на «Global Drought and Flood»
Представляем Вашему вниманию похожие книги на «Global Drought and Flood» списком для выбора. Мы отобрали схожую по названию и смыслу литературу в надежде предоставить читателям больше вариантов отыскать новые, интересные, ещё непрочитанные произведения.


Обсуждение, отзывы о книге «Global Drought and Flood» и просто собственные мнения читателей. Оставьте ваши комментарии, напишите, что Вы думаете о произведении, его смысле или главных героях. Укажите что конкретно понравилось, а что нет, и почему Вы так считаете.