Global Drought and Flood
Здесь есть возможность читать онлайн «Global Drought and Flood» — ознакомительный отрывок электронной книги совершенно бесплатно, а после прочтения отрывка купить полную версию. В некоторых случаях можно слушать аудио, скачать через торрент в формате fb2 и присутствует краткое содержание. Жанр: unrecognised, на английском языке. Описание произведения, (предисловие) а так же отзывы посетителей доступны на портале библиотеки ЛибКат.
- Название:Global Drought and Flood
- Автор:
- Жанр:
- Год:неизвестен
- ISBN:нет данных
- Рейтинг книги:5 / 5. Голосов: 1
-
Избранное:Добавить в избранное
- Отзывы:
-
Ваша оценка:
Global Drought and Flood: краткое содержание, описание и аннотация
Предлагаем к чтению аннотацию, описание, краткое содержание или предисловие (зависит от того, что написал сам автор книги «Global Drought and Flood»). Если вы не нашли необходимую информацию о книге — напишите в комментариях, мы постараемся отыскать её.
Global Drought and Flood: Observation, Modeling, and Prediction Volume highlights include:
Remote sensing approaches for mapping droughts and floods Physical and statistical models for monitoring and forecasting hydrologic hazards Features of various drought and flood systems and products Use by governments, humanitarian, and development stakeholders in recent disaster cases Improving the collaboration between hazard information provision and end users The American Geophysical Union promotes discovery in Earth and space science for the benefit of humanity. Its publications disseminate scientific knowledge and provide resources for researchers, students, and professionals.
Global Drought and Flood — читать онлайн ознакомительный отрывок
Ниже представлен текст книги, разбитый по страницам. Система сохранения места последней прочитанной страницы, позволяет с удобством читать онлайн бесплатно книгу «Global Drought and Flood», без необходимости каждый раз заново искать на чём Вы остановились. Поставьте закладку, и сможете в любой момент перейти на страницу, на которой закончили чтение.
Интервал:
Закладка:
Harpold et al. (2017) divided snow drought into two categories: (a) warm snow drought, where accumulated precipitation during October–March is larger than the long‐term average and SWE on 1st April is less than the long‐term average; (b) dry snow drought, where accumulated precipitation for the same period is less than the long‐term average and SWE on 1st April is less than the long‐term average SWE.
In addition to the conceptual definition of snow drought, operational systems require relevant indicators to monitor snow drought. These indicators should provide insight on frequency, severity, and duration of snow drought and help to develop prevention and mitigation strategies (Paneque, 2015). Indices such as SPI or PDSI are widely used to characterize hydrological droughts, however, these indices do not explicitly account for the effects of snow on water availability in snow‐dominated watersheds (Mote et al., 2016). Staudinger et al. (2014) proposed a drought index that would account for snow. This new index, termed Standardized Snow Melt and Rain Index (SMRI), is calculated similar to the SPI but uses summation of snowmelt and rain as input. The authors proposed an algorithm based on temperature threshold that does not require snow data and utilizes temperature and precipitation to model snow. It should be noted that the output of any snow model could be used to calculate the index. Knowles et al. (2017) developed a snow aridity index (SAI) to assess ecosystem disturbance based on a long history of snow remote sensing. The SAI is defined as a ratio of the sum of 1st April to 31st August PET to maximum SWE ( PET/SWE ; Figure 1.8). It can be argued that SAI is a suitable index for characterizing snow drought since it uses both potential evapotranspiration and SWE (Knowles et al., 2017, 2018).
Snowpack is often characterized in terms of snow albedo (SA), snow depth (SD), SWE, DPS, snow covered area (SCA), and fractional snow‐covered area (fSCA) (Kongoli et al., 2012). Remote sensing can effectively describe the relationship between snowpack dynamics and climate variability (Guan et al., 2012). Using remote sensing techniques and retrieval algorithms to measure snow‐related variables may provide insight for real‐time snow drought monitoring. The following provides a very short review of different remote sensing data and products that can be used to characterize snowpack.
Snow possesses a strong spectral gradient that ranges from high albedo in visible wavelengths to low reflectance in middle infrared wavelengths. Therefore, a commonly used method such as the band ratios can be utilized to map and monitor snow cover (Lettenmaier et al., 2015). The Normalized Difference Snow Index (NDSI) is one that shows the presence of snow on the ground. The NDSI algorithm distinguishes between snow and most cloud types, therefore, it better characterizes the snow cover areas than fSCA. The NDSI utilizes the reflectance ratios to detect snow and is described as the normalized difference between green and SWIR reflectance ( R Green− R SWIR2)/( R Green+ R SWIR2) (Hall et al., 2002). Hatchett and McEvoy (2018) suggested using NDSI in conjunction with data from ground‐based observation networks to monitor snow drought. In forested regions, however, the NDSI has shown poor snow identification accuracy and the recently developed Normalized Difference Forest Snow Index (NDFSI) can produce higher identification accuracy. The NDFSI utilizes near‐infrared in place of the green band, which has a higher reflectance that is useful when there is snow in a forested area (X. Y. Wang et al., 2015).
Several satellites are capable of detecting fSCA, such as the AVHRR, MODIS, and Landsat. However, a common issue with AVHRR is the inadequacy of its 1 km spatial resolution for snow mapping on small catchments (Simpson et al., 1998; H. Xu et al., 1993). Rott et al. (2010) suggested that the Cold Regions Hydrology High‐Resolution Observatory (CoReH2O) from the ESA would deliver accurate and spatially detailed observations of snow mass. MODIS and Landsat Thematic Mapper (TM) alleviate this shortcoming to some extent by offering observations with a spatial resolution of 250 m and 30 m, respectively (Hall et al., 2002). A major concern regarding the optical‐based satellites, however, is the discontinuity of observations due to the presence of clouds. Clouds hinder the spatiotemporal consistency of snow cover due to having similar reflectance properties to snow in a wide range of the electromagnetic spectrum (Aghakouchak, Farahmand, et al., 2015). On the other hand, microwave measurements can be used to estimate fSCA and SD even in the presence of clouds, since they do not depend on sunlight reflection. Similar to optical‐based satellites, the microwave observations become flawed once SD exceeds 30 cm and in melting conditions (Foster et al., 1997; Walker & Goodison, 1993). Therefore, more accurate and consistent measurements of SD retrievals can be achieved through an integrated framework by combining observations from both types of satellites (Durand et al., 2008; Foster et al., 2011). In an effort to simulate the spatiotemporal distribution of SWE in mountainous regions, the NASA Jet Propulsion Laboratory (JPL) Airborne Snow Observatory (ASO) provides near‐weekly lidar surveys. The derived SDs obtained from lidar scanners are then assimilated into hydrological models to produce higher temporal resolution of SWE distribution and volume. Recently, Hedrick et al. (2018) combined the iSnobal physically based distributed snowmelt model with ASO and produced daily SWE images with spatial resolution of 50 m.
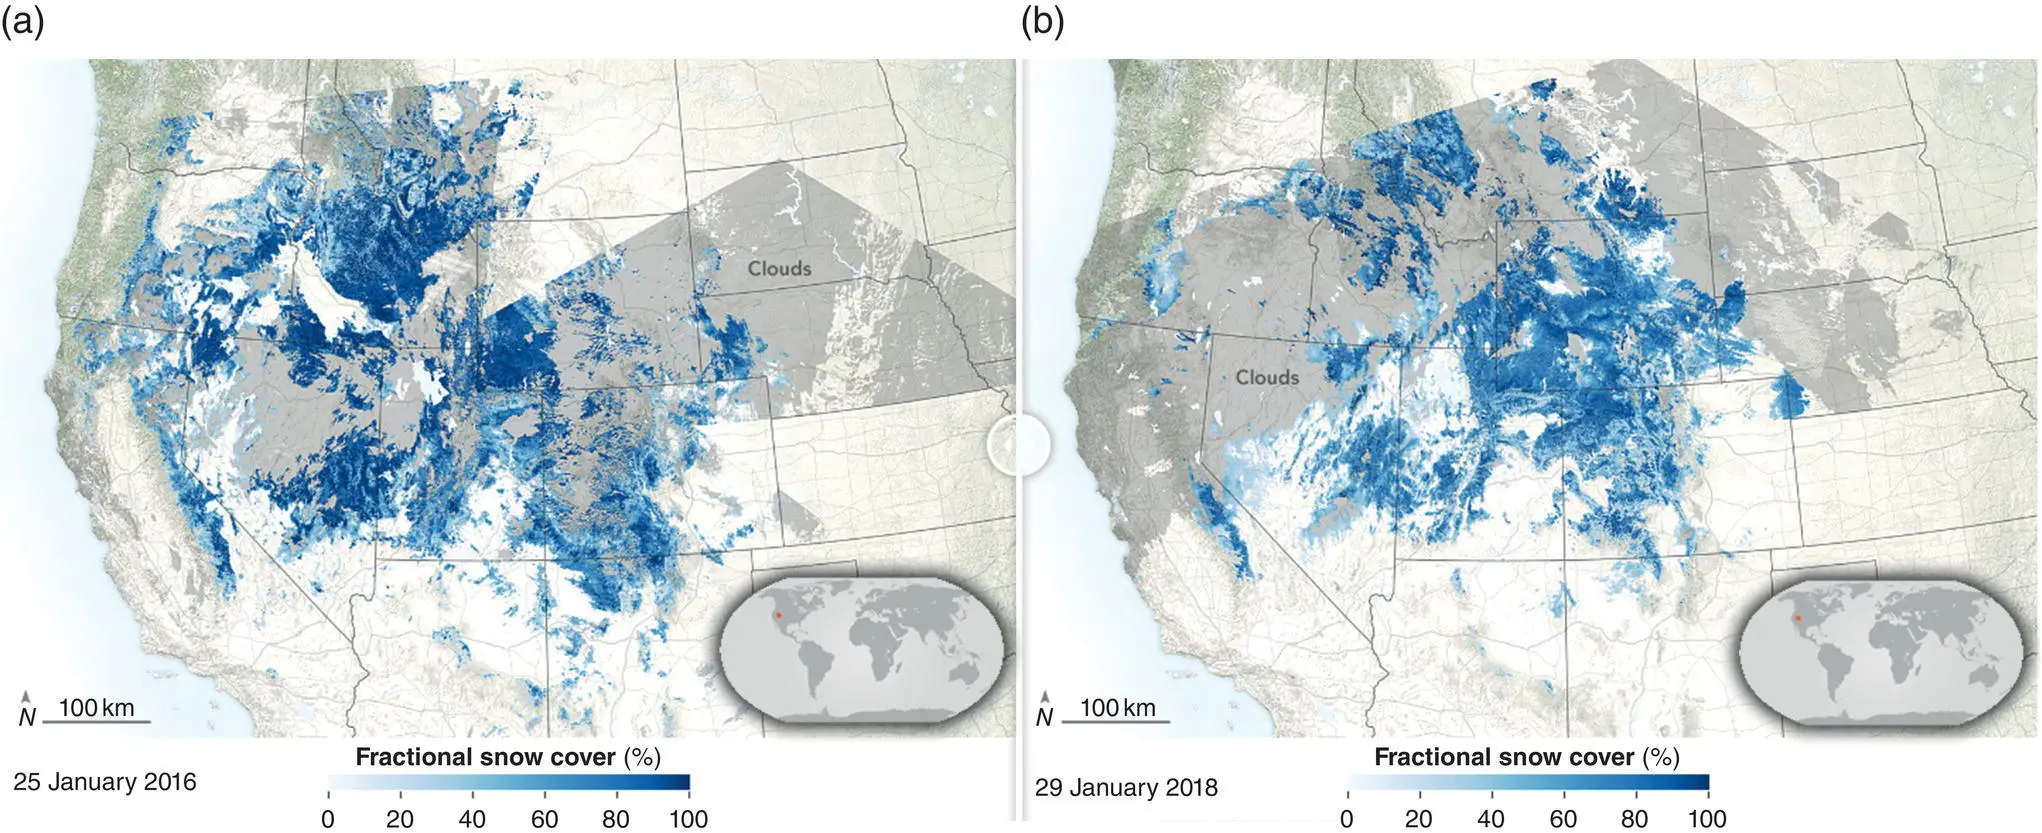
Figure 1.8 A below‐normal snowpack observed by the Moderate Resolution Imaging Spectroradiometer (MODIS) on NASA’s Terra satellite. (a) Percent of fractional snow cover on 25 January 2016. (b) Below normal conditions in 29 January 2018.
(Courtesy of NASA’s earth observatory: https://earthobservatory.nasa.gov/images)
Snow water equivalent is a critical parameter for hydrological applications and the characterization of snowpacks, and is commonly estimated using passive microwave signals utilizing empirical relationships or radiative transfer models. Well‐known limitations of spaceborne passive microwave data, such as coarse spatial resolution, saturation in deep snowpack, and signal loss in wet snow, however, present major drawbacks for passive microwave retrieval algorithms. Brodzik et al. (2016) developed high‐resolution passive microwave brightness temperature data that can be used to improve the SWE estimate in mountainous regions with complex physiography.
Peak SWE is an important variable in snow hydrology, traditionally, 1st April has been set as the date of peak SWE, however, many studies have shown that the peak SWE happens at different times. Margulis et al. (2016) showed that the assumption of 1st April peak SWE can lead to a significant underestimation of peak SWE. They also highlighted the role of elevation and interannual variability of peak SWE in the Sierra Nevada (California). Snow models and observations in situ are complementary tools that can be used in conjunction with remote sensing to accurately estimate the peak SWE and the date of peak SWE.
Although application of snow‐based drought indices for drought monitoring by remote sensing has been increased recently (Knowles et al., 2017; Sadegh, Love, et al., 2017; Staudinger et al., 2014), the majority of research incorporates satellite observations of snow data into land‐surface and climate models (He et al., 2011; Kumar et al. 2014, Margulis et al., 2006, 2016). Global drought models based on snow are primarily challenged by the time lag between occurrences of precipitation as snow and changes in ground and surface waters that could vary between weeks to months depending on catchment characteristics and climate (Aghakouchak, Farahmand, et al., 2015; Van Loon & Van Lanen, 2012). As a final note, interested readers are encouraged to explore the different snow drought tools available online at ( https://www.drought.gov/drought/data‐maps‐tools/snow‐drought).
Читать дальшеИнтервал:
Закладка:
Похожие книги на «Global Drought and Flood»
Представляем Вашему вниманию похожие книги на «Global Drought and Flood» списком для выбора. Мы отобрали схожую по названию и смыслу литературу в надежде предоставить читателям больше вариантов отыскать новые, интересные, ещё непрочитанные произведения.


Обсуждение, отзывы о книге «Global Drought and Flood» и просто собственные мнения читателей. Оставьте ваши комментарии, напишите, что Вы думаете о произведении, его смысле или главных героях. Укажите что конкретно понравилось, а что нет, и почему Вы так считаете.