Saeid Sanei - EEG Signal Processing and Machine Learning
Здесь есть возможность читать онлайн «Saeid Sanei - EEG Signal Processing and Machine Learning» — ознакомительный отрывок электронной книги совершенно бесплатно, а после прочтения отрывка купить полную версию. В некоторых случаях можно слушать аудио, скачать через торрент в формате fb2 и присутствует краткое содержание. Жанр: unrecognised, на английском языке. Описание произведения, (предисловие) а так же отзывы посетителей доступны на портале библиотеки ЛибКат.
- Название:EEG Signal Processing and Machine Learning
- Автор:
- Жанр:
- Год:неизвестен
- ISBN:нет данных
- Рейтинг книги:3 / 5. Голосов: 1
-
Избранное:Добавить в избранное
- Отзывы:
-
Ваша оценка:
EEG Signal Processing and Machine Learning: краткое содержание, описание и аннотация
Предлагаем к чтению аннотацию, описание, краткое содержание или предисловие (зависит от того, что написал сам автор книги «EEG Signal Processing and Machine Learning»). Если вы не нашли необходимую информацию о книге — напишите в комментариях, мы постараемся отыскать её.
EEG Signal Processing and Machine Learning — читать онлайн ознакомительный отрывок
Ниже представлен текст книги, разбитый по страницам. Система сохранения места последней прочитанной страницы, позволяет с удобством читать онлайн бесплатно книгу «EEG Signal Processing and Machine Learning», без необходимости каждый раз заново искать на чём Вы остановились. Поставьте закладку, и сможете в любой момент перейти на страницу, на которой закончили чтение.
Интервал:
Закладка:
Waves in frequencies much higher than the normal activity range of EEG, mostly in the range of 200–300 Hz have been found in cerebellar structures of animals, but they have not played any role in clinical neurophysiology [5, 6].
Figure 2.1shows the typical normal brain rhythms with their usual amplitude levels. In general, the EEG signals are the projection of neural activities which are attenuated by leptomeninges, cerebrospinal fluid, dura matter, bone, galea, and the scalp. Cortiographic discharges show amplitudes of 0.5–1.5 mV in range and up to several millivolts for spikes. However, on the scalp the amplitudes commonly lie within 10–100 μV.
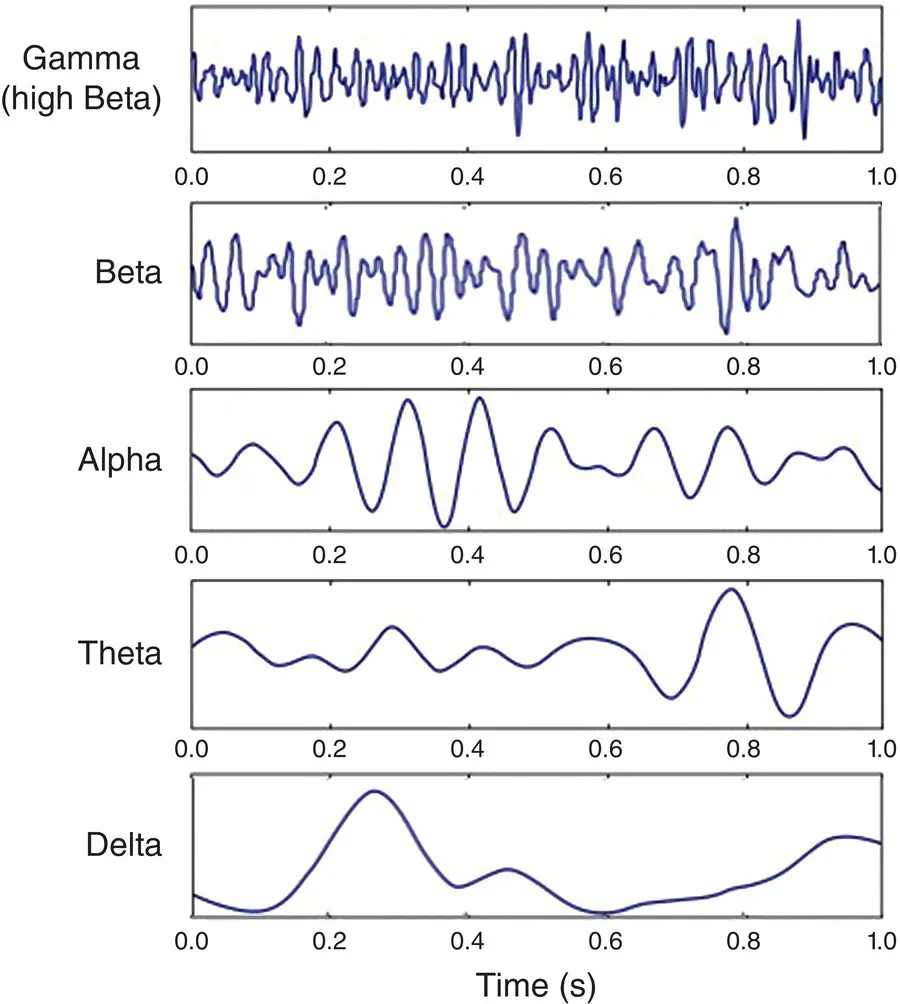
Figure 2.1 Five (can be categorized as four) typical dominant brain normal rhythms, from high to low frequencies. The delta wave is observed in infants and sleeping adults, the theta wave in children and sleeping adults, the alpha wave is detected in the occipital brain region when there is no attention, the beta wave appears frontally and parietally with low amplitude during attention and concentration, and gamma for stressed brain under heavy workload.
The above rhythms may last if the state of the subject does not change and therefore they are approximately cyclic in nature. Conversely, there are other brain waveforms, which may:
1 Have a wide frequency range or appear as spiky type signals such as K‐complexes, vertex waves (which happen during sleep), or a breach rhythm, which is an alpha‐type rhythm due to cranial bone defect [7], which does not respond to movement, and is found mainly over the midtemporal region (under electrodes T3 or T4), and some seizure signals.
2 Be a transient such as an event‐related potential (ERP) and contain positive occipital sharp transient (POST) signals (also called rho [ρ]) waves.
3 Originate from the defected regions of the brain such as tumoural brain lesions.
4 Be spatially localized and considered as cyclic in nature, but can be easily blocked by physical movement such as mu rhythm. Mu denotes motor and is strongly related to the motor cortex. Rolandic (central) mu is related to posterior alpha in terms of amplitude and frequency. However, the topography and physiological significance are quite different. From the mu rhythm one can investigate the cortical functioning and the changes in brain (mostly bilateral) activities subject to physical and imaginary movements. The mu rhythm has also been used in feedback training for several purposes such as treatment of epileptic seizure disorder [1].
Also, there are other rhythms introduced by researchers such as:
1 Phi (φ) rhythm (less than 4 Hz) occurring within two seconds of eye closure. The phi rhythm was introduced by Daly [3].
2 The kappa (κ) rhythm, which is an anterior temporal alpha‐like rhythm and it is believed to be the result of discrete lateral oscillations of the eyeballs and is considered to be an artefact signal.
3 The sleep spindles (also called sigma [σ] activity) within the 11–15 Hz frequency range.
4 Tau (τ) rhythm which represents the alpha activity in the temporal region.
5 Eyelid flutter with closed eyes which gives rise to frontal artefacts in the alpha band.
6 Chi rhythm is a mu‐like activity believed to be a specific rolandic pattern of 11–17 Hz. This wave has been observed during the course of Hatha Yoga exercises [8].
7 Lambda (λ) waves are most prominent in waking patients, although they are not very common. They are sharp transients occurring over the occipital region of the head of walking subjects during visual exploration. They are positive and time‐locked to saccadic eye movement with varying amplitude, generally below 90 μV [9].
The chart in Figure 2.2shows all possible waveforms which may appear in a scalp EEG. The waveforms can be normal or abnormal rhythms during awake or sleep as well as various artefacts.
Often it is difficult to understand and detect the brain rhythms from the scalp EEGs even with trained eyes. Application of advanced signal processing tools, however, should enable separation and analysis of the desired waveforms from within the EEGs. Therefore, definition of foreground and background EEG is very subjective and entirely depends on the abnormalities and applications. We next consider the development in the recording and measurement of EEG signals.
An early model for the generation of brain rhythms is that of Jansen and Rit [10]. This model uses a set of parameters to produce alpha activity through an interaction between inhibitory and excitatory signal generation mechanisms in a single area. The basic idea behind these models is to make excitatory and inhibitory populations interact such that oscillations emerge. This model was later modified and extended to generate and emulate the other main brain rhythms, i.e. delta, theta, beta, and gamma, too [11]. The assumptions and mathematics involved in building the Jansen model and its extension are explained in this chapter. Application of such models in generation of post‐synaptic potentials and using them as the template to detect, separate, or extract ERPs is of great importance. In Chapter 3of this book, we can see the use of such templates in the extraction of the ERPs.
2.2 EEG Recording and Measurement
Acquiring signals and images from the human body has become vital for early diagnosis of a variety of diseases. Such data can be in the form of electrobiological signals such as electrocardiogram (ECG) from the heart, electromyography (EMG) from muscles, electroencephalography (EEG) from the brain, magnetoencepalogram (MEG) from the brain, electrogastrography (EGG) from the stomach, and electro‐oculography (electro‐optigraphy, EOG) from eye nerves. Measurements can also have the form of one type of ultrasound or radiograph such as sonograph (or ultrasound image), computerized tomography (CT), magnetic resonance imaging (MRI) or functional MRI (fMRI), positron emission tomography (PET), and single photon emission tomography (SPET).
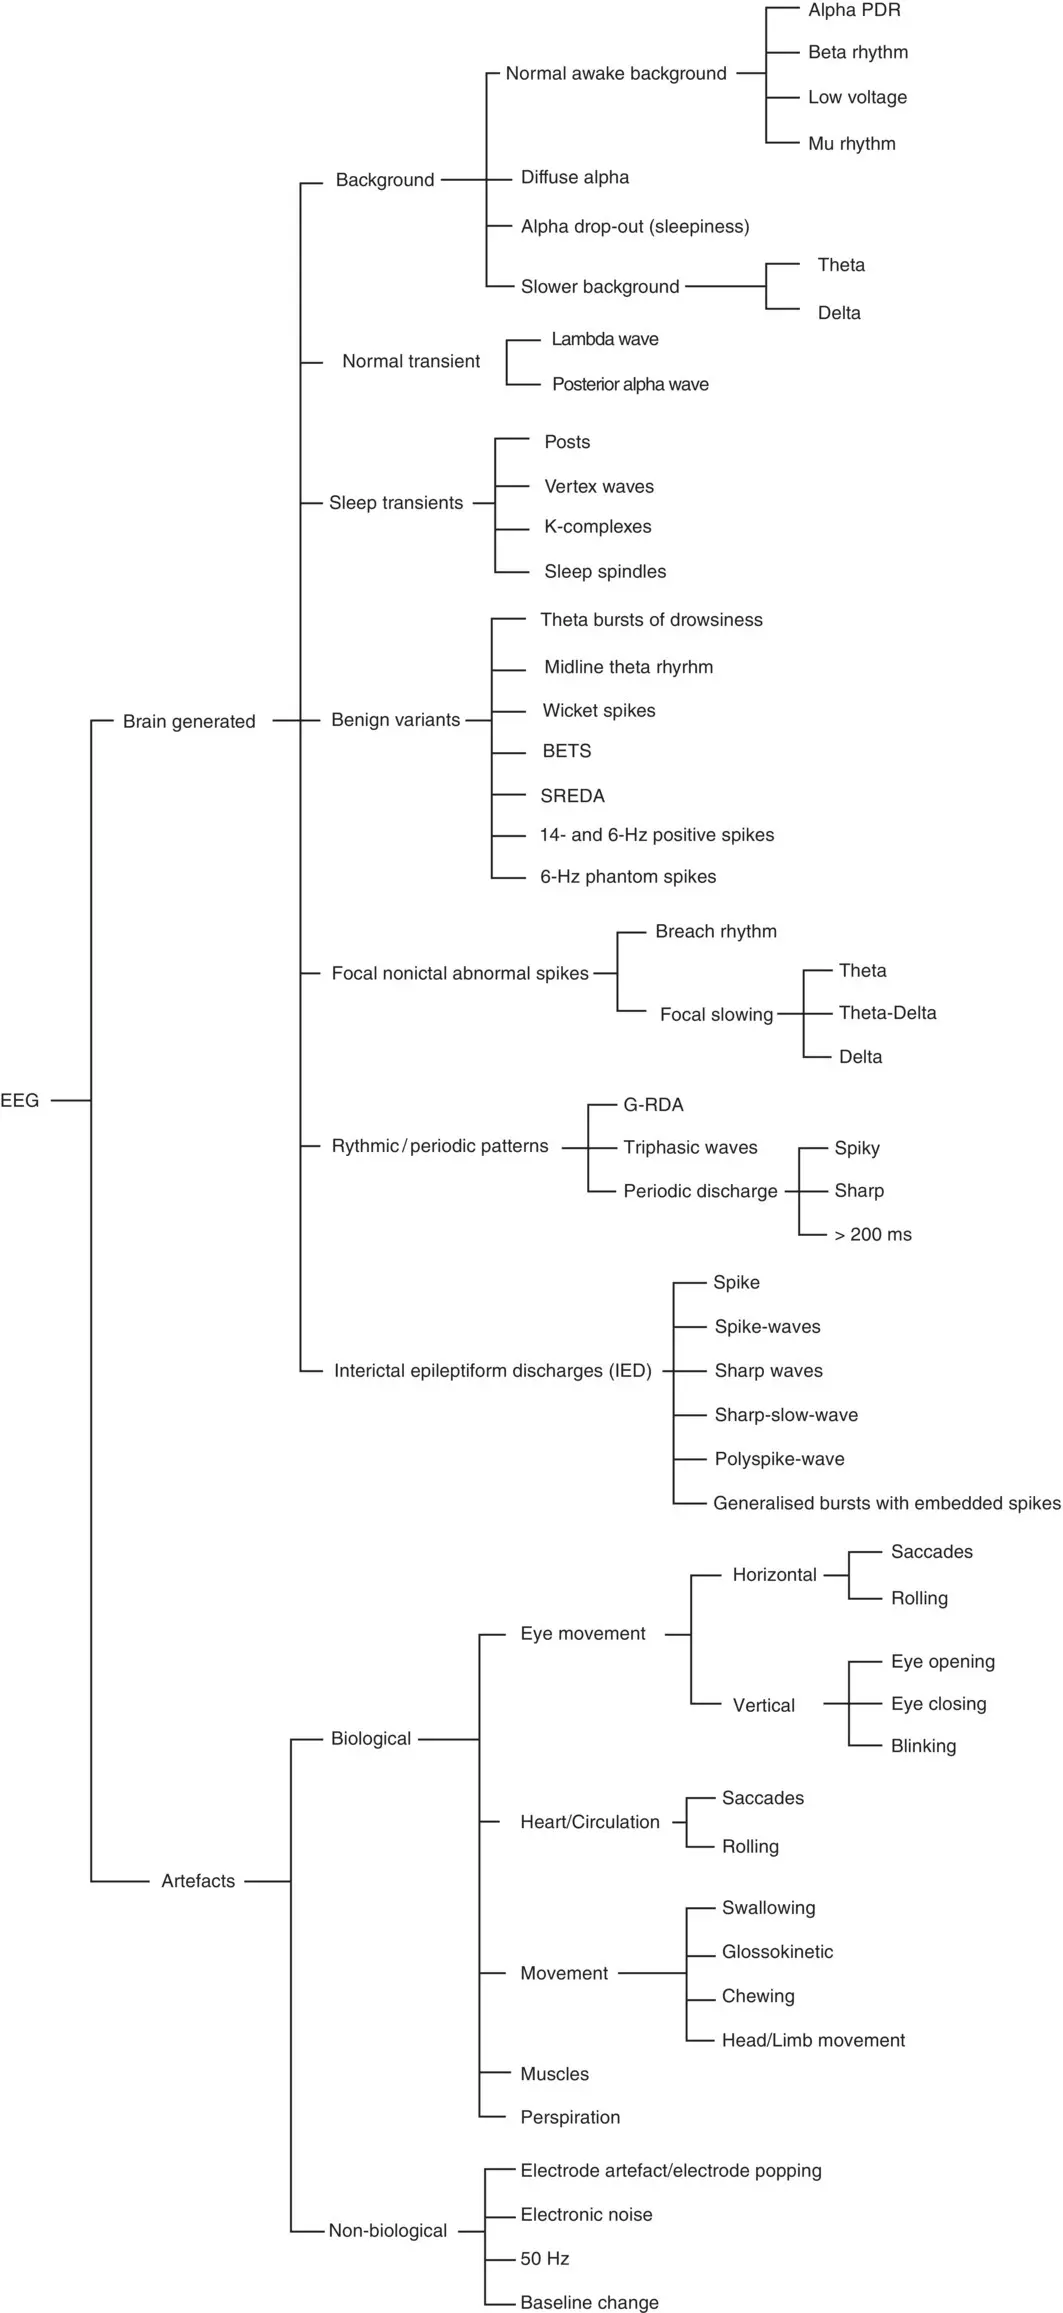
Figure 2.2 Different waveforms that may appear in the EEG while awake or during sleep periods.
Functional and physiological changes within the brain may be registered by either EEG, MEG, or fMRI. Application of fMRI is however very limited in comparison with EEG or MEG due to a number of important reasons:
1 The time resolution of fMRI image sequences is very low (for example approximately two frames per second), whereas complete EEG bandwidth can be viewed using EEG or MEG signals.
2 Many types of mental activities, brain disorders, and mal functions of the brain cannot be registered using fMRI since their effect on the level of oxygenated blood is low.
3 The accessibility to fMRI (and currently to MEG) systems is limited and costly.
4 The spatial resolution of EEG however, is limited to the number of recording electrodes (or number of coils for MEG).
The first electrical neural activities were registered using simple galvanometers. In order to magnify very fine variations of the pointer a mirror was used to reflect the light projected to the galvanometer on the wall. The d'Arsonval galvanometer later featured a mirror mounted on a movable coil and the light focused on the mirror was reflected when a current passed the coil. The capillary electrometer was introduced by Marey and Lippmann [12]. The string galvanometer, as a very sensitive and more accurate measuring instrument, was introduced by Einthoven in 1903. This became a standard instrument for a few decades and enabled photographic recording.
Читать дальшеИнтервал:
Закладка:
Похожие книги на «EEG Signal Processing and Machine Learning»
Представляем Вашему вниманию похожие книги на «EEG Signal Processing and Machine Learning» списком для выбора. Мы отобрали схожую по названию и смыслу литературу в надежде предоставить читателям больше вариантов отыскать новые, интересные, ещё непрочитанные произведения.


Обсуждение, отзывы о книге «EEG Signal Processing and Machine Learning» и просто собственные мнения читателей. Оставьте ваши комментарии, напишите, что Вы думаете о произведении, его смысле или главных героях. Укажите что конкретно понравилось, а что нет, и почему Вы так считаете.