Rodolfo Araneo - Electrical Safety Engineering of Renewable Energy Systems
Здесь есть возможность читать онлайн «Rodolfo Araneo - Electrical Safety Engineering of Renewable Energy Systems» — ознакомительный отрывок электронной книги совершенно бесплатно, а после прочтения отрывка купить полную версию. В некоторых случаях можно слушать аудио, скачать через торрент в формате fb2 и присутствует краткое содержание. Жанр: unrecognised, на английском языке. Описание произведения, (предисловие) а так же отзывы посетителей доступны на портале библиотеки ЛибКат.
- Название:Electrical Safety Engineering of Renewable Energy Systems
- Автор:
- Жанр:
- Год:неизвестен
- ISBN:нет данных
- Рейтинг книги:5 / 5. Голосов: 1
-
Избранное:Добавить в избранное
- Отзывы:
-
Ваша оценка:
Electrical Safety Engineering of Renewable Energy Systems: краткое содержание, описание и аннотация
Предлагаем к чтению аннотацию, описание, краткое содержание или предисловие (зависит от того, что написал сам автор книги «Electrical Safety Engineering of Renewable Energy Systems»). Если вы не нашли необходимую информацию о книге — напишите в комментариях, мы постараемся отыскать её.
A reference to designing and developing electrical systems connected to renewable energies Electrical Safety Engineering of Renewable Energy Systems
Electrical Safety Engineering of Renewable Energy Systems
Electrical Safety Engineering of Renewable Energy Systems — читать онлайн ознакомительный отрывок
Ниже представлен текст книги, разбитый по страницам. Система сохранения места последней прочитанной страницы, позволяет с удобством читать онлайн бесплатно книгу «Electrical Safety Engineering of Renewable Energy Systems», без необходимости каждый раз заново искать на чём Вы остановились. Поставьте закладку, и сможете в любой момент перейти на страницу, на которой закончили чтение.
Интервал:
Закладка:
The cardiac muscle, whose fibers have high contractile strength, specializes in pumping blood throughout the person’s body. The contractions of the heart are stimulated by the sinoatrial node (SA), situated in the right atrium, which generates electrical impulses. The impulses propagate through the conductive tissues named Bundle of His , and Purkinje fibers , and reach the atrioventricular node (AV), situated in the center of the heart (Figure 1.1).
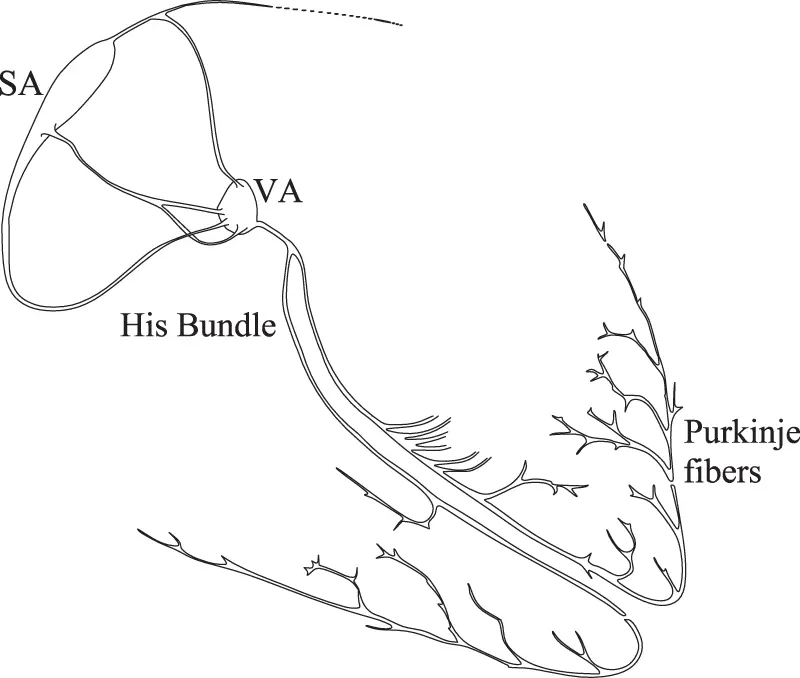
Figure 1.1 Electric conduction of the heart.
The Bundle of His, which departs from the AV, conducts the stimuli to the ventricles, which, after filling with blood, contract and push the blood through the arteries during the systole . After the contraction, the heart relaxes and fills up with blood again, awaiting further stimuli to contract again.
The net charge of the heart is zero; however, positive and negative charges are dynamically separated during each cardiac cycle and form an electric dipole vector that rotates and varies in magnitude with time. Thus, electric potential differences at different places along the person’s body also change with time during each cardiac cycle, and this can be observed in an electrocardiogram (i.e., EKG or ECG) (Figure 1.2). Usually, scalar EKG measurements are performed: vector EKGs, which may more deeply describe the heart dipole rotation, are rarely performed. Typical potential differences showed in the EKG range between 30 and 500 µV.
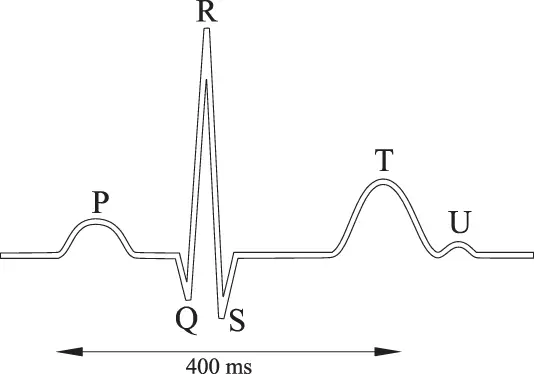
Figure 1.2 A normal electrocardiogram (EKG).
During the P wave, the right and left atria contract; during the Q-R-S complex, the right and left ventricles contract (systole). The last event of the cycle, the S-T-U interval, is the repolarization of the ventricles: they return to the resting state; their walls relax and await the next signal. This complex procedure continues as the atria refill with blood and more electrical signals are sent by the SA; the heart-period duration is around 400 ms.
The superposition of external currents of larger magnitude to the normal bodily currents will override the control signals from the brain to the skeletal and cardiac muscles, which can no longer operate as intended, exposing persons to the risk of death.
The last half of the T wave is referred to as the relative refractory period , or the vulnerable period , which is known as the crucial time interval during which external electrical stimuli (i.e., electric shock) may induce the ventricular fibrillation.
For shock durations shorter than the cardiac cycle, the ventricular fibrillation may not occur, based on the lower probability that the external stimulus occurs during the vulnerable period of the heart.
For d.c. currents, experiments on animals and data derived from electrical accidents demonstrate that the threshold of V-fib for a downward current is about twice as high as for an upward current; therefore, downward currents are less hazardous than upward currents.
For shock durations longer than the cardiac cycle (e.g., 0.5-1 s), the threshold of fibrillation for d.c. is several times higher than for a.c. However, for shock durations shorter than 200 ms, the threshold of d.c. fibrillation is approximately the same as for a.c. (measured in r.m.s. values).
1.2.2 The Heart-current Factor
The probability that the V-fib is induced is dependent upon the pathway of the body current. To compare the danger of different current paths through the body, standard IEC 60479-1 2defines the heart-current factor F [12] ( Eq. 1.1).
 (1.1)
(1.1)
Iref is the body current that determines V-fib for the path left hand to feet, and Ih is the fibrillation current for different body paths, as shown in Table 1.1.
Table 1.1 Heart-current factor F for different current paths
| Path | Heart-Current Factor F | |
|---|---|---|
| IEC | Simulated | |
| Left hand–feet | 1 | 1 |
| Hands–feet | 1 | 0.85 |
| Left hand–right hand | 0.4 | 0.75 |
| Right hand–feet | 0.8 | 0.88 |
| Hands–seat | 0.7 | 0.84 |
| Left foot–right foot | 0.04 | 0.01 |
| Left hand–right foot | 1.00 | 1.00 |
| Left hand–left foot | 1.00 | 1.00 |
| Right hand–right foot | 0.88 | – |
| Right hand–left foot | 0.8 | 0.89 |
The larger is the heart-current factor; the more dangerous is the current pathway through the body.
As an example, a current of 225 mA hand-to-hand has the same likelihood of producing ventricular fibrillation as a current of 90 mA left hand-to-both feet. Therefore, the hand-to-hand pathway is less hazardous than the left hand-to-both feet.
The IEC does advise that the published heart-current factors must be considered as a rough estimation of the relative danger of the various current paths with regard to ventricular fibrillation. The IEC formulation of the heart-current factor is, in fact, based on experiments on corpses, animals and volunteers, or data from electrical accidents. Trials on animals produce results whose extrapolation to humans may not always be reliable, due to the obvious anatomical differences. In addition, exhaustive information about electrical accidents may not be available; therefore, it may not be possible to evaluate the magnitude of the body current affecting the injured and have reliable data.
A possible alternative computation for F can be obtained through human phantoms , which are computerized models that allow the numerical simulation [13] of the current pathways through the human body when subjected to external stimuli, as shown in the last column of Table 1.1.
The comparison between the two sets of heart-current factors shows that the IEC may underestimate the magnitude of F for pathways involving the right hand, probably due to the extrapolation of the results of measurements on animals to humans.
The same heart current factors are also applicable to d.c. currents.
1.3 The Electrical Impedance of the Human Body
The electrical impedance Z Bof the human body is capacitive in nature [14] due to the capacitance C sof the skin (Figure 1.3); therefore, it depends on the frequency of the applied touch voltage.R Biis the internal body resistance; R csrepresents the resistance of the skin at the surface area of contact, which takes into account the presence of the pores, which are small conductive elements; R csis strongly variable with environmental and physiological conditions (e.g., sweaty hands).
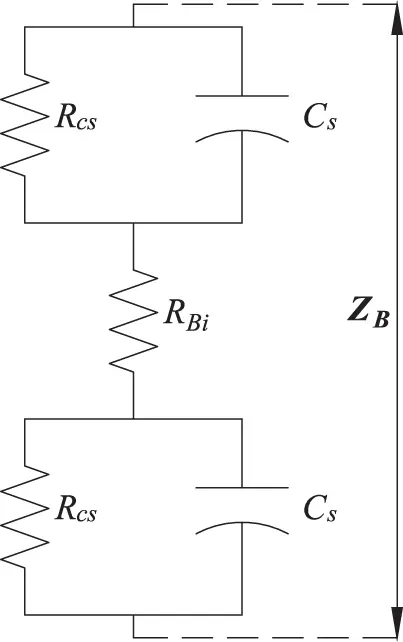
Figure 1.3 Impedances of the human body.
The model of Figure 1.3 has been validated on cadavers by analyzing the current response to a d.c. voltage V [15] (Figure 1.4).
Читать дальшеИнтервал:
Закладка:
Похожие книги на «Electrical Safety Engineering of Renewable Energy Systems»
Представляем Вашему вниманию похожие книги на «Electrical Safety Engineering of Renewable Energy Systems» списком для выбора. Мы отобрали схожую по названию и смыслу литературу в надежде предоставить читателям больше вариантов отыскать новые, интересные, ещё непрочитанные произведения.


Обсуждение, отзывы о книге «Electrical Safety Engineering of Renewable Energy Systems» и просто собственные мнения читателей. Оставьте ваши комментарии, напишите, что Вы думаете о произведении, его смысле или главных героях. Укажите что конкретно понравилось, а что нет, и почему Вы так считаете.