Change Detection and Image Time-Series Analysis 1
Здесь есть возможность читать онлайн «Change Detection and Image Time-Series Analysis 1» — ознакомительный отрывок электронной книги совершенно бесплатно, а после прочтения отрывка купить полную версию. В некоторых случаях можно слушать аудио, скачать через торрент в формате fb2 и присутствует краткое содержание. Жанр: unrecognised, на английском языке. Описание произведения, (предисловие) а так же отзывы посетителей доступны на портале библиотеки ЛибКат.
- Название:Change Detection and Image Time-Series Analysis 1
- Автор:
- Жанр:
- Год:неизвестен
- ISBN:нет данных
- Рейтинг книги:4 / 5. Голосов: 1
-
Избранное:Добавить в избранное
- Отзывы:
-
Ваша оценка:
Change Detection and Image Time-Series Analysis 1: краткое содержание, описание и аннотация
Предлагаем к чтению аннотацию, описание, краткое содержание или предисловие (зависит от того, что написал сам автор книги «Change Detection and Image Time-Series Analysis 1»). Если вы не нашли необходимую информацию о книге — напишите в комментариях, мы постараемся отыскать её.
Change Detection and Image Time-Series Analysis 1 — читать онлайн ознакомительный отрывок
Ниже представлен текст книги, разбитый по страницам. Система сохранения места последней прочитанной страницы, позволяет с удобством читать онлайн бесплатно книгу «Change Detection and Image Time-Series Analysis 1», без необходимости каждый раз заново искать на чём Вы остановились. Поставьте закладку, и сможете в любой момент перейти на страницу, на которой закончили чтение.
Интервал:
Закладка:
1.3.3. Superpixel-level compressed change vector analysis
In this section, we propose an unsupervised superpixel-level compressed change vector analysis (SPC 2VA) approach for multiclass CD. The traditional pixel-level spectral change analysis is converted into the superpixel level. Therefore, the spectral change representation and identification are regularized and enhanced under the superpixel constraints. The block scheme of the proposed approach is shown in Figure 1.4.
1.3.3.1. Superpixel-level spectral change representation
The original SCVs focus on the spectral variation representation from each individual pixel, thus ignoring spatial correlation with neighboring pixels and the local spectral homogeneity associated with real land-cover objects. This may lead to the commission and omission errors, and a decrease in the overall detection accuracy. Superpixel segmentation can capture image redundancy and generate convenient primitives to compute representative features, while reducing the complexity of the subsequent processing and analysis. In this work, we used the simple linear iterative clustering (SLIC) algorithm (Achanta et al . 2012) as the core algorithm for generating superpixel segments. Compared to the other popular segmentation methods, SLIC offers a better performance in boundary adherence and generates superpixels efficiently under the same hardware conditions. Moreover, SLIC is memory efficient, and only requires the storage of the distance from each pixel to its nearest cluster center. Most importantly, it can be smoothly integrated within the proposed method, especially from the pixel to superpixel-level spectral change representation and detection, which drives a proper algorithm utilization.
The general idea of the SLIC algorithm is to find small regional clusters by considering their local homogeneity (Achanta et al . 2012). The key step is to calculate the distance d that implements a measurement from the spectral–spatial point of view. Let dcolor and dxy be the spectral and spatial distances between two given pixels α and β , respectively, defined as:
[1.14] 
[1.15] 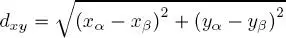
Here, (L, A, B)T denotes the CIELAB color space values, with L being the color lightness and A and B representing color values along red-green and blue-yellow axes, respectively. (x, y)T denotes the coordinates of a given pixel. A final weighted distance measure dαβ can be defined as:
[1.16] 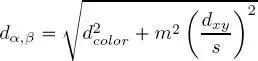
where s is the width of grids. It controls the size of created superpixels, i.e. the greater the s , the larger the superpixels. A roughly equal-sized grid interval can be defined as  where Z is the total number of pixels and N is the desired number of superpixels. In reality, the real number of generated superpixels (defined as N ′) might be slightly different from N . The parameter m controls the relative importance between the color similarity and the spatial proximity. The greater the m , the greater the emphasis on spatial proximity and the compactness of a generated superpixel. A regular m value can be defined within the range of [1, 40]. For more details, readers can refer to the paper by Achanta et al . (2012).
In order to enhance the spectral variations due to the limited bands in multispectral images, principal component analysis (PCA) is applied to the original SCVs. This strengthens the change representation and extends the feature space. The first three principal components (i.e. PCs) are used in the SLIC algorithm to generate the segments (i.e. superpixels) with the identified boundaries. Then original SCVs are stacked with the PCs to create an enhanced feature set (denoted as SCVs-PC). Note that normalization is conducted on SCVs-PC bands to make data dynamic range consistent. Finally, a mean operation is applied on each segment in the SCVs-PC bands, where the mean vector is used to replace the original SCVs-PC vectors, in order to achieve the enhanced spectral change representation at the superpixel level. Note that, by doing this, the change information is concentrated with spectral–spatial coherence and the computational cost is largely reduced when compared with the original pixel-wise processing.
1.3.3.2. Determination of the optimal segmentation scale
As mentioned previously, the number of superpixels N and the compactness factor m need to be determined in the SLIC algorithm. Note that in practical implementations, the parameter m impacts less than N on the segmentation results. Therefore, after multiple trials, we fixed m = 30 in this work. The only focus is on the determination of the optimal segmentation scale parameter N . To this end, an unsupervised strategy is applied based on the analysis of the global entropy. Note that after the mean operation on each superpixel, the texture information in the segments will be relatively suppressed, which may have an influence on the following CD performance. The main idea of the used criterion is to evaluate the information maintained in the superpixel-level segmented image inherited from the original pixel-level image. Thus, the one-dimensional image entropy (Global Entropy, GE) (Han et al . 2008) is calculated based on multi-scale segmentation results, where the optimal segmentation scale is determined by analyzing the change of GE values:
[1.17] 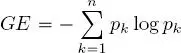
where n denotes the gray level and p = (pk)k= 1,2 ,...,n contains the histogram counts of the first three bands of Y '. It is worth noting that with the increasing N , GE values are expected to increase continuously and approach the value of the original image. The logarithmic function is then used to fit the GE results to estimate the threshold for the optimal segmentation scale. A detailed description of this step is provided in Table 1.1.
Table 1.1. Determination of the optimal segmentation scale based on GE analysis
| Step 1: Initialize N , which is approximated as the smaller one in the rows and columns ofthe input image, and the segmentation scale interval is set approximately equal to (row +column)/20. |
| Step 2: Calculate the GE value of each segmented image under different searching scales. |
| Step 3: Fit the logarithmic function on the obtained GE results and calculate the gradient. |
| Step 4: Estimate the optimal segmentation scale by analyzing the gradient of GE values, where the convergence threshold TGE is defined approximately equal to 100/(row + column) based on the input image. |
1.3.3.3. Decision fusion-based CD
Интервал:
Закладка:
Похожие книги на «Change Detection and Image Time-Series Analysis 1»
Представляем Вашему вниманию похожие книги на «Change Detection and Image Time-Series Analysis 1» списком для выбора. Мы отобрали схожую по названию и смыслу литературу в надежде предоставить читателям больше вариантов отыскать новые, интересные, ещё непрочитанные произведения.


Обсуждение, отзывы о книге «Change Detection and Image Time-Series Analysis 1» и просто собственные мнения читателей. Оставьте ваши комментарии, напишите, что Вы думаете о произведении, его смысле или главных героях. Укажите что конкретно понравилось, а что нет, и почему Вы так считаете.