Change Detection and Image Time-Series Analysis 1
Здесь есть возможность читать онлайн «Change Detection and Image Time-Series Analysis 1» — ознакомительный отрывок электронной книги совершенно бесплатно, а после прочтения отрывка купить полную версию. В некоторых случаях можно слушать аудио, скачать через торрент в формате fb2 и присутствует краткое содержание. Жанр: unrecognised, на английском языке. Описание произведения, (предисловие) а так же отзывы посетителей доступны на портале библиотеки ЛибКат.
- Название:Change Detection and Image Time-Series Analysis 1
- Автор:
- Жанр:
- Год:неизвестен
- ISBN:нет данных
- Рейтинг книги:4 / 5. Голосов: 1
-
Избранное:Добавить в избранное
- Отзывы:
-
Ваша оценка:
Change Detection and Image Time-Series Analysis 1: краткое содержание, описание и аннотация
Предлагаем к чтению аннотацию, описание, краткое содержание или предисловие (зависит от того, что написал сам автор книги «Change Detection and Image Time-Series Analysis 1»). Если вы не нашли необходимую информацию о книге — напишите в комментариях, мы постараемся отыскать её.
Change Detection and Image Time-Series Analysis 1 — читать онлайн ознакомительный отрывок
Ниже представлен текст книги, разбитый по страницам. Система сохранения места последней прочитанной страницы, позволяет с удобством читать онлайн бесплатно книгу «Change Detection and Image Time-Series Analysis 1», без необходимости каждый раз заново искать на чём Вы остановились. Поставьте закладку, и сможете в любой момент перейти на страницу, на которой закончили чтение.
Интервал:
Закладка:
The multiclass CD is implemented based on the change magnitude and direction variables (i.e. ρ and θ ) constructed by S 2CVA at the superpixel level. In paticular, a decision fusion-based CD step is proposed to enhance and optimize the binary CD output (see Figure 1.5), by analyzing the change magnitude of SCVs-PC bands. Three binary CD results are taken into account based on a majority voting process, to determine whether a given superpixel (segment) is changed or not. The first input is made from the pixel-level binary CD result constrained by the segmented boundaries, where a threshold Tρ is defined on ρ by using the EM algorithm under a Bayesian framework (denoted as Bayesian-EM) (Bruzzone and Prieto 2000a). Change and no-change pixels are counted within each superpixel, respectively, in order to determine the label of that superpixel with respect to the counting majority. The second and third inputs are generated at the superpixel level. The change magnitude of superpixels is calculated on Y', and binary CD results are obtained using Bayesian-EM thresholding and fuzzy c-means (FCM) clustering, respectively. A three-input majority voting decision is applied by integrating three binary CD results from a pixel-to-superpixel perspective. Note that the final binary CD decision is made on each superpixel, depending on the majority label of three independent inputs, as shown in Figure 1.5. FCM clustering is then applied on the variable θ but only focuses on the changed superpixels, with the given estimated number of clusters equal to K in the 2D compressed polar domain D , as shown in Figure 1.2.
1.4. Dataset description and experimental setup
1.4.1. Dataset description
The first dataset is a pair of QuickBird images acquired over an urban area in Xuzhou city, Jiangsu province (China) in September 2004 ( X 1) and May 2005 ( X 2), respectively. The Gram–Schmidt (G-S) pan-sharpening algorithm was applied to fuse the multispectral (2.4 m) and panchromatic images (0.6 m), in order to generate the final fused dataset (0.6 m) with four spectral bands (i.e. red, green, blue and near infrared). Images were radiometrically corrected and co-registered (with residual misregistration of about 0.3 pixels), and the final region with a size of 760×370 pixels was extracted for the CD experiment. A total of six change classes are presented in this scenario. Detailed class transitions are: 1) soil to built-up area (C1); 2) soil to roof (face to the sun) (C2); 3) soil to roof (back to the sun) (C3); 4) built-up area to soil (C4); 5) shadow to soil (C5); 6) trees to soil (C6). The false color composite images X 1and X 2are shown in Figure 1.6(a) and (b), respectively, and Figure 1.6(c) presents the change reference map made by careful image interpretation.
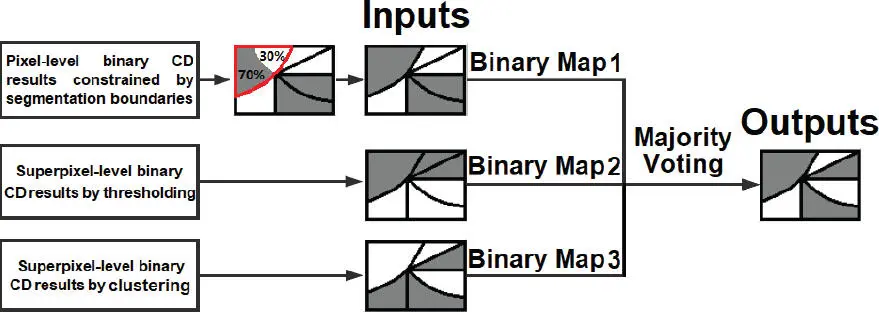
Figure 1.5. Illustration of the decision-level fusion-based binary CD step. For a color version of this figure, see www.iste.co.uk/atto/change1.zip
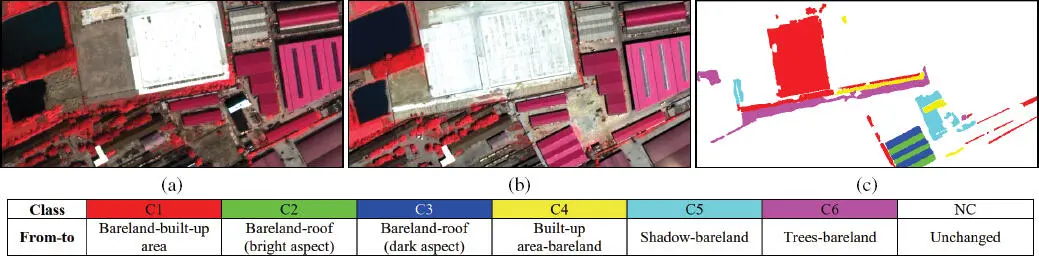
Figure 1.6. Color-infrared composite of bitemporal QuickBird pan-sharpened images (bands 4, 3, 2) over an urban area in Xuzhou city, acquired in (a) 2004 (X 1 ) and (b) 2005 (X 2 ). (c) Change reference map. For a color version of this figure, see www.iste.co.uk/atto/change1.zip
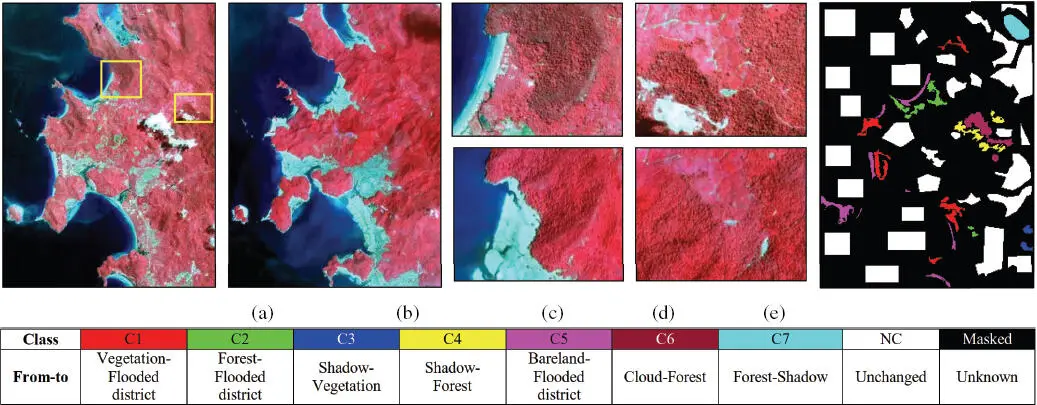
Figure 1.7. False color composite of QuickBird images of the Indonesia tsunami dataset acquired in: (a) April 2004 (before tsunami), (b) January 2005 (after tsunami); (c) and (d) are two subsets selected from the whole scene in the qualitative experimental analysis. (e) Change reference samples. For a color version of this figure, see www.iste.co.uk/atto/change1.zip
The second dataset is made up of a pair of co-registered QuickBird multispectral images with a spatial resolution of 2.4 m, acquired over a large coastal area in Indonesia in April 2004 and January 2005, respectively (see the two times of the false color composite images shown in Figure 1.7(a)and (b), respectively). The whole study area considered has a size of 3,250×4,350 pixels. Two subsets were selected for detailed qualitative analysis, as shown in Figure 1.7(c)and (d). A change reference sample map was made by careful image interpretation ( Figure 1.7(e)). The changes that occurred in this scene were mainly caused by the tsunami in December 2004, which include the following classes: (1) vegetation to flooded district (C1); (2) forest to flooded district (C2); (3) shadow to vegetation (C3); (4) shadow to forest (C4); (5) bareland to flooded district (C5); (6) cloud to forest (C6); (7) forest to shadow (C7).
1.4.2. Experimental setup
For comparison purposes, CD results obtained by the proposed M 2C 2VA and SPC 2VA approaches were compared with two state-of-the-art unsupervised multiclass CD techniques, including the iteratively reweighted multivariate alteration detection (IR-MAD) (Nielsen 2007), and the sequential spectral change vector analysis (S 2CVA) (Liu et al . 2015). Note that M 2C 2VA and SPC 2VA considered both spectral and spatial change information, whereas IR-MAD and S 2CVA considered only the spectral change information. Detailed quantitative and qualitative analyses were conducted according to the obtained CD accuracy, i.e. OA and Kappa, and error indices, i.e. omission errors (OE), commission errors (CE), total errors (TE), and the obtained CD maps. In addition, the computational cost was also considered in each method and compared. All of the experiments were conducted using MATLAB R2016b, on an Intel (R) Core (TM) i7-6700 CPU @ 3.40GHz PC with 32 GB of RAM.
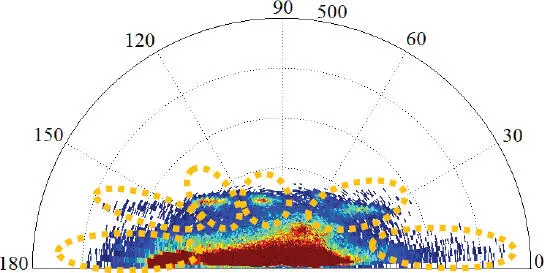
Figure 1.8. 2D compressed change representation in the polar domain (Xuzhou dataset). For a color version of this figure, see www.iste.co.uk/atto/change1.zip
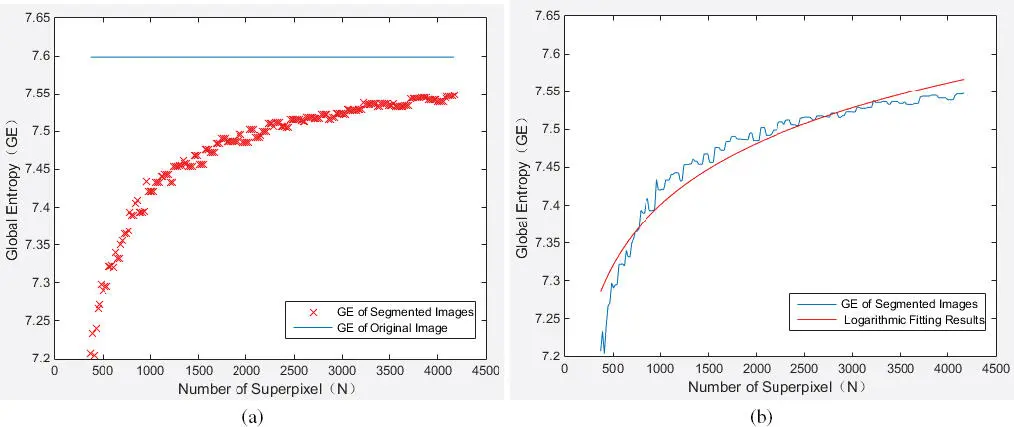
Figure 1.9. Determination of the optimal segmentation scale in the Xuzhou dataset. (a) GE values of different segmented scales; (b) logarithmic fitting results based on (a). For a color version of this figure, see www.iste.co.uk/atto/change1.zip
1.5. Results and discussion
1.5.1. Results on the Xuzhou dataset
The 2D compressed change representation in the polar domain is shown in Figure 1.8, where six change clusters can be observed, indicating different change directions. Then, K = 6 is fixed in the considered CD methods for performing the multiclass CD.
The optimal segmentation scale was estimated by analyzing the GE values (see Figure 1.9(a)) and its logarithmic fitting results (see Figure 1.9(b)). The TGE was calculated and defined as 1 × 10 −4, then the final segmentation optimal scale was obtained as 1,160.
Читать дальшеИнтервал:
Закладка:
Похожие книги на «Change Detection and Image Time-Series Analysis 1»
Представляем Вашему вниманию похожие книги на «Change Detection and Image Time-Series Analysis 1» списком для выбора. Мы отобрали схожую по названию и смыслу литературу в надежде предоставить читателям больше вариантов отыскать новые, интересные, ещё непрочитанные произведения.


Обсуждение, отзывы о книге «Change Detection and Image Time-Series Analysis 1» и просто собственные мнения читателей. Оставьте ваши комментарии, напишите, что Вы думаете о произведении, его смысле или главных героях. Укажите что конкретно понравилось, а что нет, и почему Вы так считаете.