Change Detection and Image Time-Series Analysis 1
Здесь есть возможность читать онлайн «Change Detection and Image Time-Series Analysis 1» — ознакомительный отрывок электронной книги совершенно бесплатно, а после прочтения отрывка купить полную версию. В некоторых случаях можно слушать аудио, скачать через торрент в формате fb2 и присутствует краткое содержание. Жанр: unrecognised, на английском языке. Описание произведения, (предисловие) а так же отзывы посетителей доступны на портале библиотеки ЛибКат.
- Название:Change Detection and Image Time-Series Analysis 1
- Автор:
- Жанр:
- Год:неизвестен
- ISBN:нет данных
- Рейтинг книги:4 / 5. Голосов: 1
-
Избранное:Добавить в избранное
- Отзывы:
-
Ваша оценка:
Change Detection and Image Time-Series Analysis 1: краткое содержание, описание и аннотация
Предлагаем к чтению аннотацию, описание, краткое содержание или предисловие (зависит от того, что написал сам автор книги «Change Detection and Image Time-Series Analysis 1»). Если вы не нашли необходимую информацию о книге — напишите в комментариях, мы постараемся отыскать её.
Change Detection and Image Time-Series Analysis 1 — читать онлайн ознакомительный отрывок
Ниже представлен текст книги, разбитый по страницам. Система сохранения места последней прочитанной страницы, позволяет с удобством читать онлайн бесплатно книгу «Change Detection and Image Time-Series Analysis 1», без необходимости каждый раз заново искать на чём Вы остановились. Поставьте закладку, и сможете в любой момент перейти на страницу, на которой закончили чтение.
Интервал:
Закладка:
From the detailed quantitative and qualitative analyses based on the obtained CD accuracy and error indices (see Table 1.2) and the obtained CD maps (see Figure 1.10), it can be observed that the proposed M 2C 2VA and SPC 2VA approaches resulted in higher performance than the reference methods, with respect to the higher OA and Kappa values and smaller detection errors (see Table 1.2). In particular, SPC 2VA achieved the highest accuracy (i.e. OA = 92.74% and Kappa = 0.7464), outperforming the other methods. Improvement can also be observed from the obtained change maps by comparing them with the reference map; the identified change targets are more accurate in the two proposed approaches (i.e. Figure 1.10(c)and (d)) than those in the two reference methods (i.e. Figure 1.10(a)and (b)). In two reference methods, S 2CVA showed better performance than IR-MAD. As for the computational cost, the proposed SPC 2VA approach exhibited efficient performance, which consumed less time than the proposed M 2C 2VA and IR-MAD, and similar or slightly more time than S 2CVA (i.e. 8.91 s vs. 7.12 s), but yielding a significantly higher OA value (i.e. 92.74% vs. 87.74%).

Table 1.2. Multiclass CD results obtained by the proposed and reference methods (Xuzhou dataset)
1.5.2. Results on the Indonesia tsunami dataset
The 2D compressed change representation in the polar domain is shown in Figure 1.11, where seven change clusters (i.e. K = 7) can be observed. The optimal segmentation scale was estimated as 35,140 according to Figure 1.12. Note that the CD experiment and the quantitative analysis were carried out on the whole image scene.
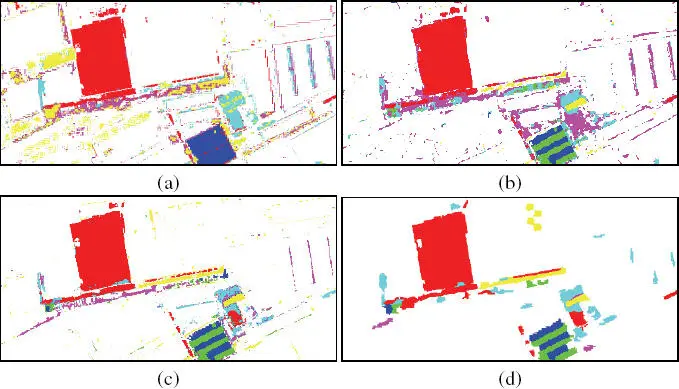
Figure 1.10. Comparison of the multiclass CD maps obtained by: (a) IR-MAD; (b) S 2 CVA; (c) proposed M 2 C 2 VA ([u, v] = [1, 6]); (d) proposed SPC 2 VA with N = 1,160 and m = 30 (Xuzhou dataset). For a color version of this figure, see www.iste.co.uk/atto/change1.zip
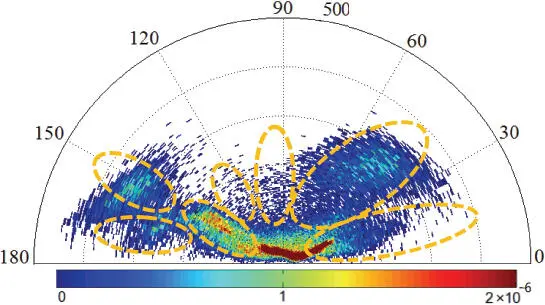
Figure 1.11. 2D compressed change representation in the polar domain (Indonesia tsunami dataset). For a color version of this figure, see www.iste.co.uk/atto/change1.zip
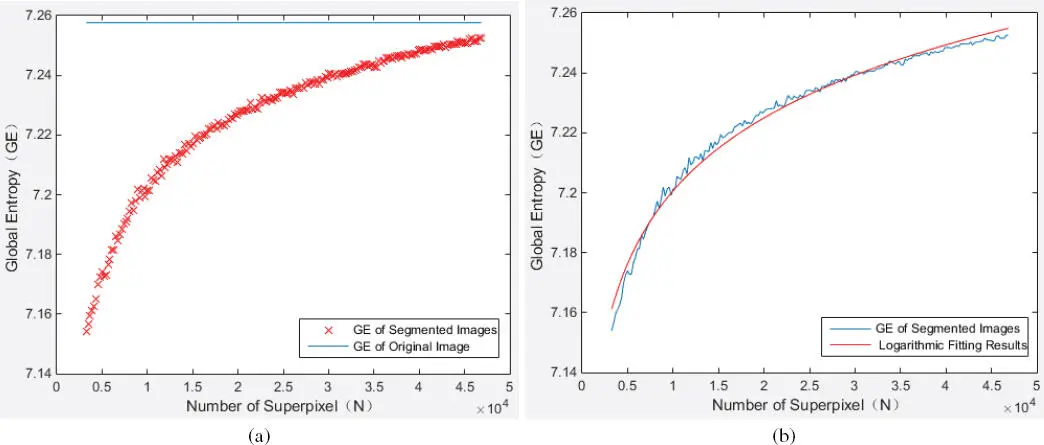
Figure 1.12. Determination of the optimal segmentation scale in the Indonesia tsunami dataset . (a) GE values of different segmented scales; (b) logarithmic fitting results based on (a). For a color version of this figure, see www.iste.co.uk/atto/change1.zip
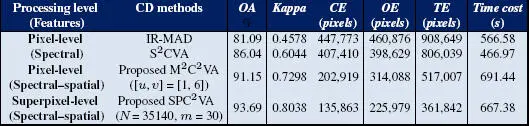
Table 1.3. Multiclass CD results obtained by the proposed and reference methods (Indonesia tsunami dataset)
We conducted a careful comparison between the qualitative and quantitative results obtained by two proposed approaches (see the CD maps in Figure 1.13(c)and (d)) and two reference methods (see CD maps in Figure 1.13(a)and (b)) as in the previous dataset. The quantitative evaluation was carried out based on the available change reference samples, as shown in Figure 1.7(e); the numeric results are provided in Table 1.3. Note that the number of multiclass changes was equal to 7 in all of the methods, as estimated in the polar domain (see Figure 1.11).
From the CD maps shown at the global scale (first row) and the local scale (second and third rows) in Figure 1.13and the CD accuracies in Table 1.3, we can see that the proposed approach SPC 2VA obtained the highest accuracy (i.e. OA: 93.69% and Kappa: 0.8244) among all of the considered methods. The proposed M 2C 2VA also showed good results and outperformed the two reference methods. Smaller detection errors were found (i.e. 361,842 and 517,007 pixels in the two proposed approaches against 908,649 and 806,039 pixels in the two reference methods), especially the CE values. The detected change targets are more homogeneous and regular with respect to their shapes and spatial distributions (see Figure 1.13(c)and (d)). This demonstrates that the proposed spectral–spatial approaches are able to deal with CD for large-scale data and offer a high detection performance, i.e. enhancing the change targets and suppressing the no-change class. For two pixel-wise reference methods, S 2CVA performed better than IR-MAD, as in the IR-MAD results, change and no-change pixels are highly mixed in their spectral representation, leading to a relatively poor detection accuracy. This is due to the complexity of the CD task in the high spatial resolution multispectral images, and the pixel-wise correlation analysis may fail to properly model the change targets solely based on spectral information. From the point of view of the computational cost, the two proposed methods resulted in a higher time cost than the two reference methods, but still at an acceptable level. Therefore, from the careful qualitative analysis on both the global and local scales of the obtained CD maps and the quantitative accuracy analysis, the effectiveness of the proposed approaches in addressing a large complex multi-CD problem is validated.
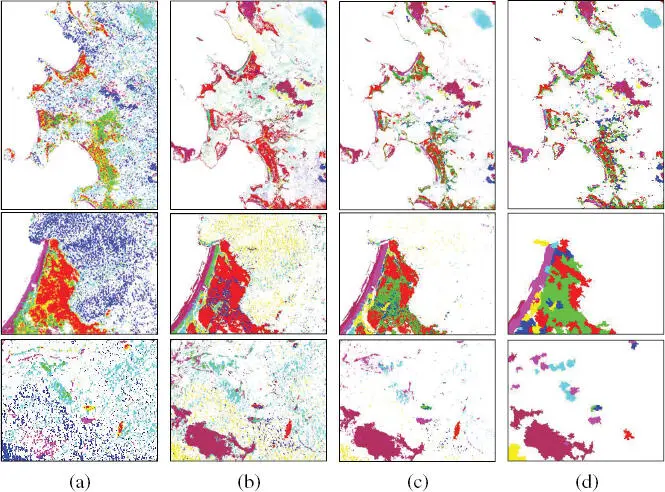
Figure 1.13. Comparison of the CD maps obtained by: (a) IR-MAD; (b) S 2 CVA; (c) proposed M 2 C 2 VA([u, v] = [1, 6]; (d) proposed SPC 2 VA with N = 35,140 and m = 30, respectively, where the first row is the whole image scene, and the second and third rows represent two subset results for a detailed visual comparison purpose (Indonesia tsunami dataset). For a color version of this figure, see www.iste.co.uk/atto/change1.zip
1.6. Conclusion
Owing to the automatic and unsupervised nature, unsupervised CD always represents a very interesting and important CD research and application frontier. However, the absence of ground reference and prior knowledge makes this practical problem more challenging and complex than the supervised ones. In this chapter, we reviewed the current development of unsupervised CD methods in multitemporal multispectral remote sensing images, and analyzed existing open issues and challenges. In particular, we focused on the spectral–spatial perspective to find robust solutions to the important multiclass CD problem. Accordingly, two approaches were proposed, including M 2C 2VA and SPC 2VA. By taking advantage of the spectral and spatial joint analysis on the multispectral change representation, the original pixel-level CD performance was enhanced by considering both the spectral variation at the global scale and the spectral homogeneity and spatial connectivity and regularity of change targets at the local scale. Experimental results obtained two real multispectral datasets covering a complex urban scenario, and a large-scale tsunami disaster scenario confirmed the effectiveness of the proposed approaches in terms of higher CD accuracy and computational efficiency when compared with the reference methods. For future works, advanced techniques still need to be designed to deal with more complex real unsupervised CD cases, mainly focusing on, but not limited to the open issues and challenges pointed out in section 1.2.2.
Читать дальшеИнтервал:
Закладка:
Похожие книги на «Change Detection and Image Time-Series Analysis 1»
Представляем Вашему вниманию похожие книги на «Change Detection and Image Time-Series Analysis 1» списком для выбора. Мы отобрали схожую по названию и смыслу литературу в надежде предоставить читателям больше вариантов отыскать новые, интересные, ещё непрочитанные произведения.


Обсуждение, отзывы о книге «Change Detection and Image Time-Series Analysis 1» и просто собственные мнения читателей. Оставьте ваши комментарии, напишите, что Вы думаете о произведении, его смысле или главных героях. Укажите что конкретно понравилось, а что нет, и почему Вы так считаете.