Paul McFedries - Excel Data Analysis For Dummies
Здесь есть возможность читать онлайн «Paul McFedries - Excel Data Analysis For Dummies» — ознакомительный отрывок электронной книги совершенно бесплатно, а после прочтения отрывка купить полную версию. В некоторых случаях можно слушать аудио, скачать через торрент в формате fb2 и присутствует краткое содержание. Жанр: unrecognised, на английском языке. Описание произведения, (предисловие) а так же отзывы посетителей доступны на портале библиотеки ЛибКат.
- Название:Excel Data Analysis For Dummies
- Автор:
- Жанр:
- Год:неизвестен
- ISBN:нет данных
- Рейтинг книги:5 / 5. Голосов: 1
-
Избранное:Добавить в избранное
- Отзывы:
-
Ваша оценка:
- 100
- 1
- 2
- 3
- 4
- 5
Excel Data Analysis For Dummies: краткое содержание, описание и аннотация
Предлагаем к чтению аннотацию, описание, краткое содержание или предисловие (зависит от того, что написал сам автор книги «Excel Data Analysis For Dummies»). Если вы не нашли необходимую информацию о книге — напишите в комментариях, мы постараемся отыскать её.
Excel Data Analysis For Dummies
Excel Data Analysis For Dummies
Excel Data Analysis For Dummies — читать онлайн ознакомительный отрывок
Ниже представлен текст книги, разбитый по страницам. Система сохранения места последней прочитанной страницы, позволяет с удобством читать онлайн бесплатно книгу «Excel Data Analysis For Dummies», без необходимости каждый раз заново искать на чём Вы остановились. Поставьте закладку, и сможете в любой момент перейти на страницу, на которой закончили чтение.
Интервал:
Закладка:
Follow these steps to summarize your data with subtotals:
1 Select a cell within the range you want to subtotal.
2 Choose Data ⇒ Subtotal.If you don’t see the Subtotal command, choose Outline ⇒ Subtotal. The Subtotal dialog box appears.
3 In the At Each Change In list, select the column you want to use to group the subtotals.
4 In the Use Function list, select Sum.
5 In the Add Subtotal To list, select the check box for the column you want to summarize.In Figure 1-8, for example, each change in the Customer field displays the sum of that customer’s Total cells.
6 Click OK.Excel calculates the subtotals and adds them into the range. Note, too, that Excel also adds outline symbols to the range. I talk about outlining in a bit more detail in the next section.
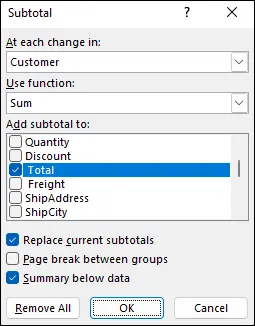
FIGURE 1-8:Use the Subtotal dialog box to apply subtotals to a range.
Figure 1-9 shows some subtotals applied to a range.
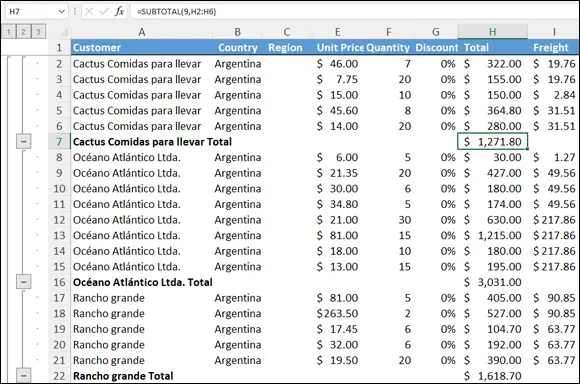
FIGURE 1-9:Some subtotals applied to the Total column for each customer.
 Note that in the phrase, automatic subtotals, the word subtotals is misleading because it implies that you can summarize your data only with totals. Not even close! Using “subtotals,” you can also count the values (all the values or just the numeric values), calculate the average of the values, determine the maximum or minimum value, and calculate the product of the values. For statistical analysis, you can also calculate the standard deviation and variance, both of a sample and of a population. To change the summary calculation, follow Steps 1 to 3, open the Use Function drop-down list, and then select the function you want to use for the summary.
Grouping Related Data
To help you analyze a worksheet, you might be able to control what parts of the worksheet are displayed by grouping the data based on the worksheet formulas and data. Grouping the data creates a worksheet outline, which works similarly to the outline feature in Microsoft Word. In a worksheet outline, you can collapse sections of the sheet to display only summary cells (such as quarterly or regional totals), or expand hidden sections to show the underlying detail. Note that when you add subtotals to a range, as I describe in the preceding section, Excel automatically groups the data and displays the outline tools.
 Not all worksheets can be grouped, so you need to make sure that your worksheet is a candidate for outlining:
The worksheet must contain formulas that reference cells or ranges directly adjacent to the formula cell. Worksheets with SUM functions that subtotal cells above or to the left are particularly good candidates for outlining.
There must be a consistent pattern to the direction of the formula references. For example, a worksheet with formulas that always reference cells above or to the left can be outlined. Excel won’t outline a worksheet with, say, SUM functions where some of the range references are above the formula cell and some are below.
Here are the steps to follow group-related data:
1 Display the worksheet you want to outline.
2 Choose Data ⇒ Group ⇒ Auto Outline.If you don’t see the Group command, choose Outline ⇒ Group. Excel outlines the worksheet data.
As shown in Figure 1-10, Excel uses level bars to indicate the grouped ranges and level numbers to indicate the various levels of the underlying data available in the outline.
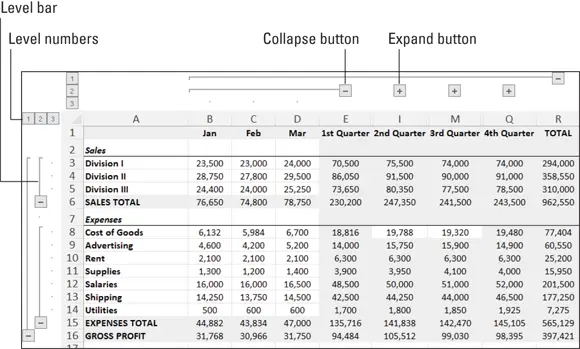
FIGURE 1-10:When you group a range, Excel displays its outlining tools.
Here are some ways you can use the outline to control the range display:
Click the − (collapse) button to hide the range indicated by the level bar.
Click the + button (expand) for a collapsed range to view it again.
Click a level number to collapse multiple ranges on the same outline level.
Click a level number to display multiple collapsed ranges on the same outline level.
Consolidating Data from Multiple Worksheets
Companies often distribute similar worksheets to multiple departments to capture budget numbers, inventory values, survey data, and so on. Those worksheets must then be combined into a summary report showing company-wide totals. Combining multiple worksheets into a summary report is called consolidating the data.
Sounds like a lot of work, right? It sure is, if you do it manually, so forget that. Instead, Excel can consolidate your data automatically. You can use the consolidate feature to consolidate the data in either of two ways:
By position: Excel consolidates the data from two or more worksheets, using the same range coordinates on each sheet. Use this method if the worksheets you’re consolidating have an identical layout.
By category: Excel consolidates the data from two or more worksheets by looking for identical row and column labels in each sheet. Reach for this method if the worksheets you’re consolidating have different layouts but common labels.
In both cases, you specify one or more source ranges (the ranges that contain the data you want to consolidate) and a destination range (the range where the consolidated data will appear).
Consolidating by position
Here are the steps to trudge through if you want to consolidate multiple worksheets by position:
1 Create a new worksheet that uses the same layout — including row and column labels — as the sheets you want to consolidate.The identical layout in this new worksheet is your destination range.
2 If necessary, open the workbooks that contain the worksheets you want to consolidate.If the worksheets you want to consolidate are in the current workbook, you can skip this step.
3 In the new worksheet from Step 1, select the upper-left corner of the destination range.
4 Choose Data ⇒ Consolidate.The Consolidate dialog box appears.
5 In the Function list, select the summary function you want to use.
6 In the Reference text box, select one of the ranges you want to consolidate.
7 Click Add.Excel adds the range to the All References list, as shown in Figure 1-11.
8 Repeat Steps 6 and 7 to add all the consolidation ranges.
9 Click OK.Excel consolidates the data from the source ranges and displays the summary in the destination range.
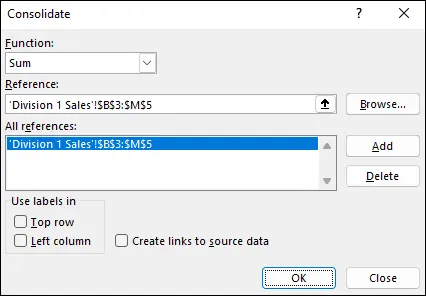
FIGURE 1-11:Consolidate multiple worksheets by adding a range from each one.
 If the source data changes, you probably want to reflect those changes in the consolidation worksheet. Rather than run the entire consolidation over again, a much easier solution is to select the Create Links to Source Data check box in the Consolidate dialog box. You can then update the consolidation worksheet by choosing Data ⇒ Refresh All.
Интервал:
Закладка:
Похожие книги на «Excel Data Analysis For Dummies»
Представляем Вашему вниманию похожие книги на «Excel Data Analysis For Dummies» списком для выбора. Мы отобрали схожую по названию и смыслу литературу в надежде предоставить читателям больше вариантов отыскать новые, интересные, ещё непрочитанные произведения.
Обсуждение, отзывы о книге «Excel Data Analysis For Dummies» и просто собственные мнения читателей. Оставьте ваши комментарии, напишите, что Вы думаете о произведении, его смысле или главных героях. Укажите что конкретно понравилось, а что нет, и почему Вы так считаете.


