Paul McFedries - Excel Data Analysis For Dummies
Здесь есть возможность читать онлайн «Paul McFedries - Excel Data Analysis For Dummies» — ознакомительный отрывок электронной книги совершенно бесплатно, а после прочтения отрывка купить полную версию. В некоторых случаях можно слушать аудио, скачать через торрент в формате fb2 и присутствует краткое содержание. Жанр: unrecognised, на английском языке. Описание произведения, (предисловие) а так же отзывы посетителей доступны на портале библиотеки ЛибКат.
- Название:Excel Data Analysis For Dummies
- Автор:
- Жанр:
- Год:неизвестен
- ISBN:нет данных
- Рейтинг книги:5 / 5. Голосов: 1
-
Избранное:Добавить в избранное
- Отзывы:
-
Ваша оценка:
Excel Data Analysis For Dummies: краткое содержание, описание и аннотация
Предлагаем к чтению аннотацию, описание, краткое содержание или предисловие (зависит от того, что написал сам автор книги «Excel Data Analysis For Dummies»). Если вы не нашли необходимую информацию о книге — напишите в комментариях, мы постараемся отыскать её.
Excel Data Analysis For Dummies
Excel Data Analysis For Dummies
Excel Data Analysis For Dummies — читать онлайн ознакомительный отрывок
Ниже представлен текст книги, разбитый по страницам. Система сохранения места последней прочитанной страницы, позволяет с удобством читать онлайн бесплатно книгу «Excel Data Analysis For Dummies», без необходимости каждый раз заново искать на чём Вы остановились. Поставьте закладку, и сможете в любой момент перейти на страницу, на которой закончили чтение.
Интервал:
Закладка:
Answer: Displays information about the model’s objective cell, variable cells, and constraints. For the objective cell and variable cells, Solver shows the original and final values.
Sensitivity: Attempts to show how sensitive a solution is to changes in the model’s formulas. The layout of the Sensitivity report depends on the type of model you’re using.
Limits: Displays the objective cell and its value, as well as the variable cells and their addresses, names, and values.
 Solver can use one of several solving methods. In the Solver Parameters dialog box, use the Select a Solving Method list to select one of the following:
Simplex LP: Use if your worksheet model is linear. In the simplest possible terms, a linear model is one in which the variables are not raised to any powers and none of the so-called transcendent functions — such as SIN and COS — are used.
GRG Nonlinear: Use if your worksheet model is nonlinear and smooth. In general terms, a smooth model is one in which a graph of the equation doesn’t show sharp edges or breaks.
Evolutionary: Use if your worksheet model is nonlinear and nonsmooth.
Do you have to worry about any of this? Almost certainly not. Solver defaults to using GRG Nonlinear, and that should work for almost anything you do with Solver.
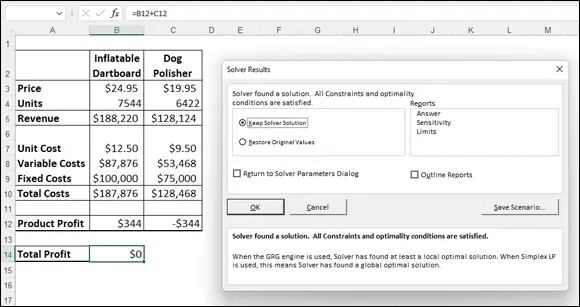
FIGURE 2-13:The Solver Results dialog box and the solution to the break-even problem.
Adding constraints to Solver
The real world puts restrictions and conditions on formulas. A factory might have a maximum capacity of 10,000 units a day, the number of employees in a company can’t be a negative number, and your advertising costs might be restricted to 10 percent of total expenses.
Similarly, suppose that you’re running a break-even analysis on two products, as I discuss in the preceding section. If you run the optimization without any restrictions, Solver might reach a total profit of 0 by setting one product at a slight loss and the other at a slight profit, where the loss and profit cancel each other out. In fact, if you take a close look at Figure 2-13, this is exactly what Solver did. To get a true break-even solution, you might prefer to see both product profit values as 0.
Such restrictions and conditions are examples of what Solver calls constraints. Adding constraints tells Solver to find a solution so that these conditions are not violated.
Here’s how to run Solver with constraints added to the optimization:
1 Choose Data ⇒ Solver.Excel opens the Solver Parameters dialog box.
2 Use the Set Objective box, the To group, and the By Changing Variable Cells box to set up Solver as I describe in the preceding section, “ Optimizing a result with Solver .”
3 Click Add.Excel displays the Add Constraint dialog box.
4 In the Cell Reference box, enter the address of the cell you want to constrain.You can type the address or select the cell on the worksheet.
5 In the drop-down list, select the operator you want to use.Most of the time, you use a comparison operator, such as equal to (=) or greater than (>). Use the int (integer) operator when you need a constraint, such as total employees, to be an integer value instead of a real number (that is, a number with a decimal component; you can't have 10.5 employees!). Use the bin (binary) operator when you have a constraint that must be either TRUE or FALSE (or 1 or 0).
6 If you chose a comparison operator in Step 5, in the Constraint box, enter the value by which you want to restrict the cell.Figure 2-14 shows an example of a completed Add Constraint dialog box. In the example model, this constraint tells Solver to find a solution such that the product profit of the Inflatable Dartboard (cell B12) is equal to 0. FIGURE 2-14:The completed Add Constraint dialog box.
7 To specify more constraints, click Add and repeat Steps 4 through 6, as needed.For the example, you add a constraint that asks for the Dog Polisher product profit (cell C12) to be 0.
8 Click OK.Excel returns to the Solver Parameters dialog box and displays your constraints in the Subject to the Constraints list box.
9 Click Solve.
10 In any Show Trial Solution dialog box that appears, click Continue to move things along.Figure 2-15 shows the example break-even solution with the constraints added. Note that not only is the Total Profit cell (B14) set to 0, but so are the two Product Profit cells (B12 And C12).
11 Select the Keep Solver Solution option.If you don’t want to accept the result, select the Restore Original Values option instead.
12 Click OK.
 You can add a maximum of 100 constraints. Also, if you need to make a change to a constraint before you begin solving, select the constraint in the Subject to the Constraints list box, click Change, and then make your adjustments in the Change Constraint dialog box that appears. If you want to delete a constraint that you no longer need, select the constraint and then click Delete.
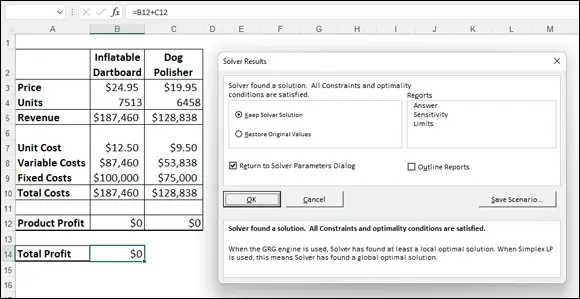
FIGURE 2-15:The Solver Results dialog box and the final solution to the break-even problem.
Save a Solver solution as a scenario
Whenever you have a spreadsheet model that uses a coherent set of input values — known as changing cells — you have what Excel calls a scenario. With Solver, these changing cells are its variable cells, so a Solver solution amounts to a kind of scenario. However, Solver does not give you an easy way to save and rerun a particular solution. To work around this problem, you can save a solution as a scenario that you can then later recall using Excel’s scenario manager feature.
Follow these steps to save a Solver solution as a scenario:
1 Choose Data ⇒ Solver.Excel opens the Solver Parameters dialog box.
2 Use the Set Objective box, the To group, the By Changing Variable Cells box, and the Subject to the Constraints list to set up Solver as I describe in the “ Optimizing a result with Solver ” section, previously in this chapter.
3 Click Solve.
4 Anytime the Show Trial Solution dialog box appears, choose Continue.When the optimization is complete, Excel displays the Solver Results dialog box.
5 Click Save Scenario.Excel displays the Save Scenario dialog box.
6 In the Scenario Name dialog box, type a name for the scenario and then click OK.Excel returns you to the Solver Results dialog box.
7 Select the Keep Solver Solution option.If you don’t want to accept the result, select the Restore Original Values option instead.
8 Click OK.
Конец ознакомительного фрагмента.
Текст предоставлен ООО «ЛитРес».
Прочитайте эту книгу целиком, на ЛитРес.
Безопасно оплатить книгу можно банковской картой Visa, MasterCard, Maestro, со счета мобильного телефона, с платежного терминала, в салоне МТС или Связной, через PayPal, WebMoney, Яндекс.Деньги, QIWI Кошелек, бонусными картами или другим удобным Вам способом.
Интервал:
Закладка:
Похожие книги на «Excel Data Analysis For Dummies»
Представляем Вашему вниманию похожие книги на «Excel Data Analysis For Dummies» списком для выбора. Мы отобрали схожую по названию и смыслу литературу в надежде предоставить читателям больше вариантов отыскать новые, интересные, ещё непрочитанные произведения.


Обсуждение, отзывы о книге «Excel Data Analysis For Dummies» и просто собственные мнения читателей. Оставьте ваши комментарии, напишите, что Вы думаете о произведении, его смысле или главных героях. Укажите что конкретно понравилось, а что нет, и почему Вы так считаете.