Paul McFedries - Excel Data Analysis For Dummies
Здесь есть возможность читать онлайн «Paul McFedries - Excel Data Analysis For Dummies» — ознакомительный отрывок электронной книги совершенно бесплатно, а после прочтения отрывка купить полную версию. В некоторых случаях можно слушать аудио, скачать через торрент в формате fb2 и присутствует краткое содержание. Жанр: unrecognised, на английском языке. Описание произведения, (предисловие) а так же отзывы посетителей доступны на портале библиотеки ЛибКат.
- Название:Excel Data Analysis For Dummies
- Автор:
- Жанр:
- Год:неизвестен
- ISBN:нет данных
- Рейтинг книги:5 / 5. Голосов: 1
-
Избранное:Добавить в избранное
- Отзывы:
-
Ваша оценка:
Excel Data Analysis For Dummies: краткое содержание, описание и аннотация
Предлагаем к чтению аннотацию, описание, краткое содержание или предисловие (зависит от того, что написал сам автор книги «Excel Data Analysis For Dummies»). Если вы не нашли необходимую информацию о книге — напишите в комментариях, мы постараемся отыскать её.
Excel Data Analysis For Dummies
Excel Data Analysis For Dummies
Excel Data Analysis For Dummies — читать онлайн ознакомительный отрывок
Ниже представлен текст книги, разбитый по страницам. Система сохранения места последней прочитанной страницы, позволяет с удобством читать онлайн бесплатно книгу «Excel Data Analysis For Dummies», без необходимости каждый раз заново искать на чём Вы остановились. Поставьте закладку, и сможете в любой момент перейти на страницу, на которой закончили чтение.
Интервал:
Закладка:
Solver seeks not only a desired result (the “goal” in Goal Seek) but also the optimal one. For example, looking for an optimal result might mean that you can find a solution that’s the maximum or minimum possible.
For complex problems, Solver can generate multiple solutions. You can then save these different solutions under different scenarios.
When should you use Solver?
Okay, I’ll be straight with you: Solver is a powerful tool that most Excel users don’t need. It would be overkill, for example, to use Solver to compute net profit given fixed revenue and cost figures. Some problems, however, require nothing less than the Solver approach. These problems cover many different fields and situations, but they all have the following characteristics in common:
They have a single objective cell (also called the target cell ) that contains a formula you want to maximize, minimize, or set to a specific value. This formula could be a calculation such as total transportation expenses or net profit.
The objective cell formula contains references to one or more variable cells (also called unknowns or changing cells ). Solver adjusts these cells to find the optimal solution for the objective cell formula. These variable cells might include items such as units sold, shipping costs, or advertising expenses.
Optionally, there are one or more constraint cells that must satisfy certain criteria. For example, you might require that advertising be less than 10 percent of total expenses, or that the discount to customers be an amount between 40 and 60 percent.
For example, Figure 2-11 shows a worksheet data model that’s all set up for Solver. The model shows revenue (price times units sold) and costs for two products, the profit produced by each product, and the total profit. The question to be answered here is this: How many units of each product must be sold to get a total profit of $0? This is known in business as a break-even analysis.
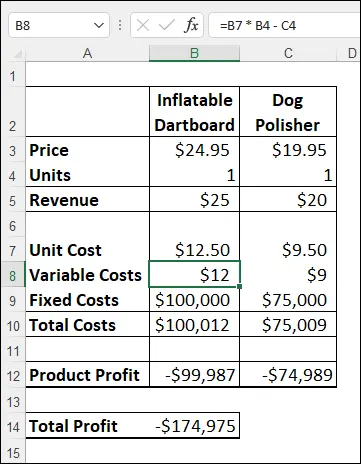
FIGURE 2-11:The goal for this data model is to find the break-even point (where total profit is $0).
That sounds like a straightforward Goal Seek task, but this model has a tricky aspect: the variable costs. Normally, the variable costs of a product are its unit cost times the number of units sold. If it costs $10 to produce product A and you sell 10,000 units, the variable costs for that product are $100,000. However, in the real world, such costs are often mixed up among multiple products. For example, if you run a joint advertising campaign for two products, the costs are borne by both products. Therefore, this model assumes that the costs of one product are related to the units sold of the other.
Here, for example, is the formula used to calculate the costs of the Inflatable Dartboard (cell B8):
=B7 * B4 – C4
In other words, the variable costs for the Inflatable Dartboard are reduced by one dollar for every unit sold of the Dog Polisher. The latter’s variable costs use a similar formula (in cell C8):
=C7 * C4 – B4
Having the variable costs related to multiple products puts this data model outside of what Goal Seek can do, but Solver is up to the challenge. Here are the special cells in the model that Solver will use:
The objective cell is C14; the total profit and the target solution for this formula is 0 (that is, the break-even point).
The changing cells are B4 and C4, which hold the number of units sold for each product.
For constraints, you might want to add that both the product profit cells (B12 and C12) should also be 0.
Loading the Solver add-in
An add-in is software that adds one or more features to Excel. Installing add-ins gives you additional Excel features that aren’t available on the Ribbon by default. Bundled add-in software is included with Excel but isn’t automatically installed when you install Excel. Several add-ins come standard with Excel, including Solver.
You install bundled add-ins by using the Excel Options dialog box; you can find them in the Add-Ins section. After they're installed, add-ins are available right away. They usually appear on a tab related to their function. For example, Solver appears on the Data tab.
Here are the steps to follow to load the Solver add-in:
1 Choose File ⇒ Options.The Excel Options dialog box appears.
2 Choose Add-Ins.
3 In the Manage list, select Excel Add-Ins and then select Go.Excel displays the Add-Ins dialog box.
4 Select the Solver Add-In check box.
5 Click OK.Excel adds a Solver button to the Data tab’s Analysis group.
Optimizing a result with Solver
You set up your Solver model by using the Solver Parameters dialog box. In the Set Objective field, you specify the objective cell. You use the options in the To group to tell Solver what you want from the objective cell: the maximum possible value, the minimum possible value, or a specific value. Finally, you use the By Changing Variable Cells box to specify the cells that Solver can use to plug in values to optimize the result.
 When Solver finds a solution, you can choose either Keep Solver Solution or Restore Original Values. If you choose Keep Solver Solution, Excel permanently changes the worksheet. You can’t undo the changes.
With your Solver-ready worksheet model prepared, here are the steps to follow to find an optimal result for your model using Solver:
1 Choose Data ⇒ Solver.Excel opens the Solver Parameters dialog box.
2 In the Set Objective box, enter the address of your model’s objective cell.In the example in the “ When should you use Solver?” section, previously in the chapter (refer to Figure 2-11), the objective cell is B14. Note that if you click the cell to enter it, Solver automatically enters an absolute cell address (for example, $B$14 instead of B14). Solver works fine either way.
3 In the To group, select an option:Max: Returns the maximum possible value.Min: Returns the minimum possible value.Value Of: Enter a number to set the objective cell to that number.For the example model, I selected Value Of and entered 0 in the text box.
4 In the By Changing Variable Cells box, enter the addresses of the cells you want Solver to change while it looks for a solution.In the example, the changing cells are B4 and C4. Figure 2-12 shows the completed Solver Parameters dialog box. (What about constraints? I talk about those in the next section.) FIGURE 2-12:The completed Solver Parameters dialog box.
5 Click Solve.Solver gets down to business. As Solver works on the problem, the Show Trial Solution dialog boxes might show up one or more times.
6 In any Show Trial Solution dialog box that appears, click Continue to move things along.When the optimization is complete, Excel displays the Solver Results dialog box, shown in Figure 2-13.
7 Select the Keep Solver Solution option.If you don't want to accept the result, select the Restore Original Values option instead.
8 Click OK.
 You can ask Solver to display one or more reports that give you extra information about the results. In the Solver Results dialog box, use the Reports list to select each report you want to view:
Интервал:
Закладка:
Похожие книги на «Excel Data Analysis For Dummies»
Представляем Вашему вниманию похожие книги на «Excel Data Analysis For Dummies» списком для выбора. Мы отобрали схожую по названию и смыслу литературу в надежде предоставить читателям больше вариантов отыскать новые, интересные, ещё непрочитанные произведения.


Обсуждение, отзывы о книге «Excel Data Analysis For Dummies» и просто собственные мнения читателей. Оставьте ваши комментарии, напишите, что Вы думаете о произведении, его смысле или главных героях. Укажите что конкретно понравилось, а что нет, и почему Вы так считаете.