Geophysical Monitoring for Geologic Carbon Storage
Здесь есть возможность читать онлайн «Geophysical Monitoring for Geologic Carbon Storage» — ознакомительный отрывок электронной книги совершенно бесплатно, а после прочтения отрывка купить полную версию. В некоторых случаях можно слушать аудио, скачать через торрент в формате fb2 и присутствует краткое содержание. Жанр: unrecognised, на английском языке. Описание произведения, (предисловие) а так же отзывы посетителей доступны на портале библиотеки ЛибКат.

- Название:Geophysical Monitoring for Geologic Carbon Storage
- Автор:
- Жанр:
- Год:неизвестен
- ISBN:нет данных
- Рейтинг книги:4 / 5. Голосов: 1
-
Избранное:Добавить в избранное
- Отзывы:
-
Ваша оценка:
Geophysical Monitoring for Geologic Carbon Storage: краткое содержание, описание и аннотация
Предлагаем к чтению аннотацию, описание, краткое содержание или предисловие (зависит от того, что написал сам автор книги «Geophysical Monitoring for Geologic Carbon Storage»). Если вы не нашли необходимую информацию о книге — напишите в комментариях, мы постараемся отыскать её.
Geophysical Monitoring for Geologic Carbon Storage
Volume highlights include: Geophysical Monitoring for Geologic Carbon Storage
The American Geophysical Union promotes discovery in Earth and space science for the benefit of humanity. Its publications disseminate scientific knowledge and provide resources for researchers, students, and professionals.
Geophysical Monitoring for Geologic Carbon Storage — читать онлайн ознакомительный отрывок
Ниже представлен текст книги, разбитый по страницам. Система сохранения места последней прочитанной страницы, позволяет с удобством читать онлайн бесплатно книгу «Geophysical Monitoring for Geologic Carbon Storage», без необходимости каждый раз заново искать на чём Вы остановились. Поставьте закладку, и сможете в любой момент перейти на страницу, на которой закончили чтение.
Интервал:
Закладка:
Attenuation of the Young's modulus appears to be more strongly affected by the finite frequency effect than the stiffness (the real part of the moduli), as seen in the increasing attenuation during the experiment ( Fig. 5.5a and c). Particularly, for the core‐perpendicular fracture case ( Fig. 5.5b and d), the frequency effect is quite dramatic. Figure 5.9shows the observed changes during scCO 2injection into Frac IIa and Frac IIb samples, extracted from Figure 5.5b and d and correlated to the X‐ray CT images of scCO 2. In contrast to the behavior predicted by the Gassmann model, the largest changes in the Young's modulus occur once scCO 2reaches the fracture (pore space CO 2saturation of the core ~2% for Frac IIa and ~5% for Frac IIb), corresponding to a peak and a subsequent rapid drop in the attenuation. Attenuation exhibits secondary increases as scCO 2invades more of the fracture and the rock matrix.
Table 5.2 Modeling parameters
| Parameter | Symbol | Value |
|---|---|---|
| Undrained frame Young's modulus | E U | 20.5 GPa |
| Matrix frame shear modulus | G | 7.60 GPa |
| Matrix Biot‐Willis effective stress coefficient | α | 0.769 |
| Matrix porosity | φ | 16.7% |
| Mineral bulk modulus | K s | 38 GPa |
| Mineral density | ρ s | 2,650 kg/m 3 |
| Water density |  |
989 kg/m 3 |
| scCO 2density |  |
535 kg/m 3 |
| Water bulk modulus |  |
2.46 GPa |
| scCO 2bulk modulus |  |
0.04 GPa |
| Sample length | H | 10.0 cm |
| Sample diameter | a | 3.81 cm |
| Fracture aperture (core parallel) | h | 0.54 mm |
| Fracture aperture (core perpendicular) | h | 0.26 mm |
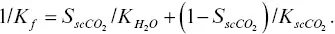
Note: Unlisted poroelastic parameters such as α , B , K U, K D, E D, M are derived from these parameters using Gassmann relationships for isotropic poroelastic media. The fluid bulk modulus K fis given as a function of the scCO 2pore saturation  via
via
The rock’s effective stress coefficient α is computed from undrained bulk modulus K U= E U G / 3(3 G – E U), K f, and the porosity φ via

The abrupt changes in the attenuation can be explained by coexisting two attenuation mechanisms. The first mechanism is the effect of the heterogeneous and patchy scCO 2distribution in the rock matrix, as seen for the intact cores. As assumed by the patchy‐saturation model (e.g., Azuma et al., 2013), pressure in these patches does not equilibrate with the water in the surrounding rock if ultrasonic waves are used for the measurements (i.e., there is no fluid flow across the boundaries). However, with the current, sonic‐frequency measurements, seismic waves cause higher pressure within the stiff, water‐saturated part of the rock, which drives the water toward the softer, scCO 2‐saturated part. With increasing volume of the rock where the two fluids coexist, the overall attenuation of the sample increases as scCO 2is injected into the sample.
The second mechanism is the attenuation caused by the interaction between a high‐porosity, high‐compliance fracture and a lower‐porosity, low‐compliance rock matrix. At the initial, water‐saturated state, attenuation in the sample is large. This is because seismic waves induce enhanced pressure changes within the compliant fracture, which drives dynamic fluid exchange with the matrix and dissipates a large amount of energy. This attenuation becomes small once the compliance of the fluid in the fracture increases, and the fracture‐driven motions of the water in the rock matrix diminish.
This reduction is expected to be large if scCO 2fills the fracture faster than the surrounding matrix, resulting in similar wave‐induced pressures within the fracture and the matrix. As the CT images in Figure 5.9indicate, this situation appears to be the case in our experiments: fast passing of the fluid is seen along high‐permeability sedimentary layers (Frac IIb test) and the sample‐Mylar interface (Frac IIa test). Figure 5.10compares the scCO 2saturations for only the fracture and for the entire core for Frac IIb test. This plot indicates that when rapid changes in the Young's modulus and the attenuation occur (core scCO 2saturation ~5%–7%), nearly 50% of the fracture is already saturated with scCO 2, although from the CT images, most of the matrix near the fracture is still fully saturated with water. The final saturation of the fracture is also much higher (~83%) compared with the average over the entire core (~17.5%). As more pores near the fracture are invaded by scCO 2, because wave‐induced pore pressure in the matrix also decreases, the attenuation caused by the fluid movement between the fracture and the matrix increases again. Additionally, introduction of scCO 2in the second half of the core increases attenuation further.
The above effect can be examined semiquantitatively by comparing the changes in the Skempton coefficients of the fracture and the rock matrix during fluid substitution. Under uniaxial stress, assuming an undrained state (i.e., only the “driving force” of the fluid flow is examined here), pore pressure and axial stress in the rock matrix are related by
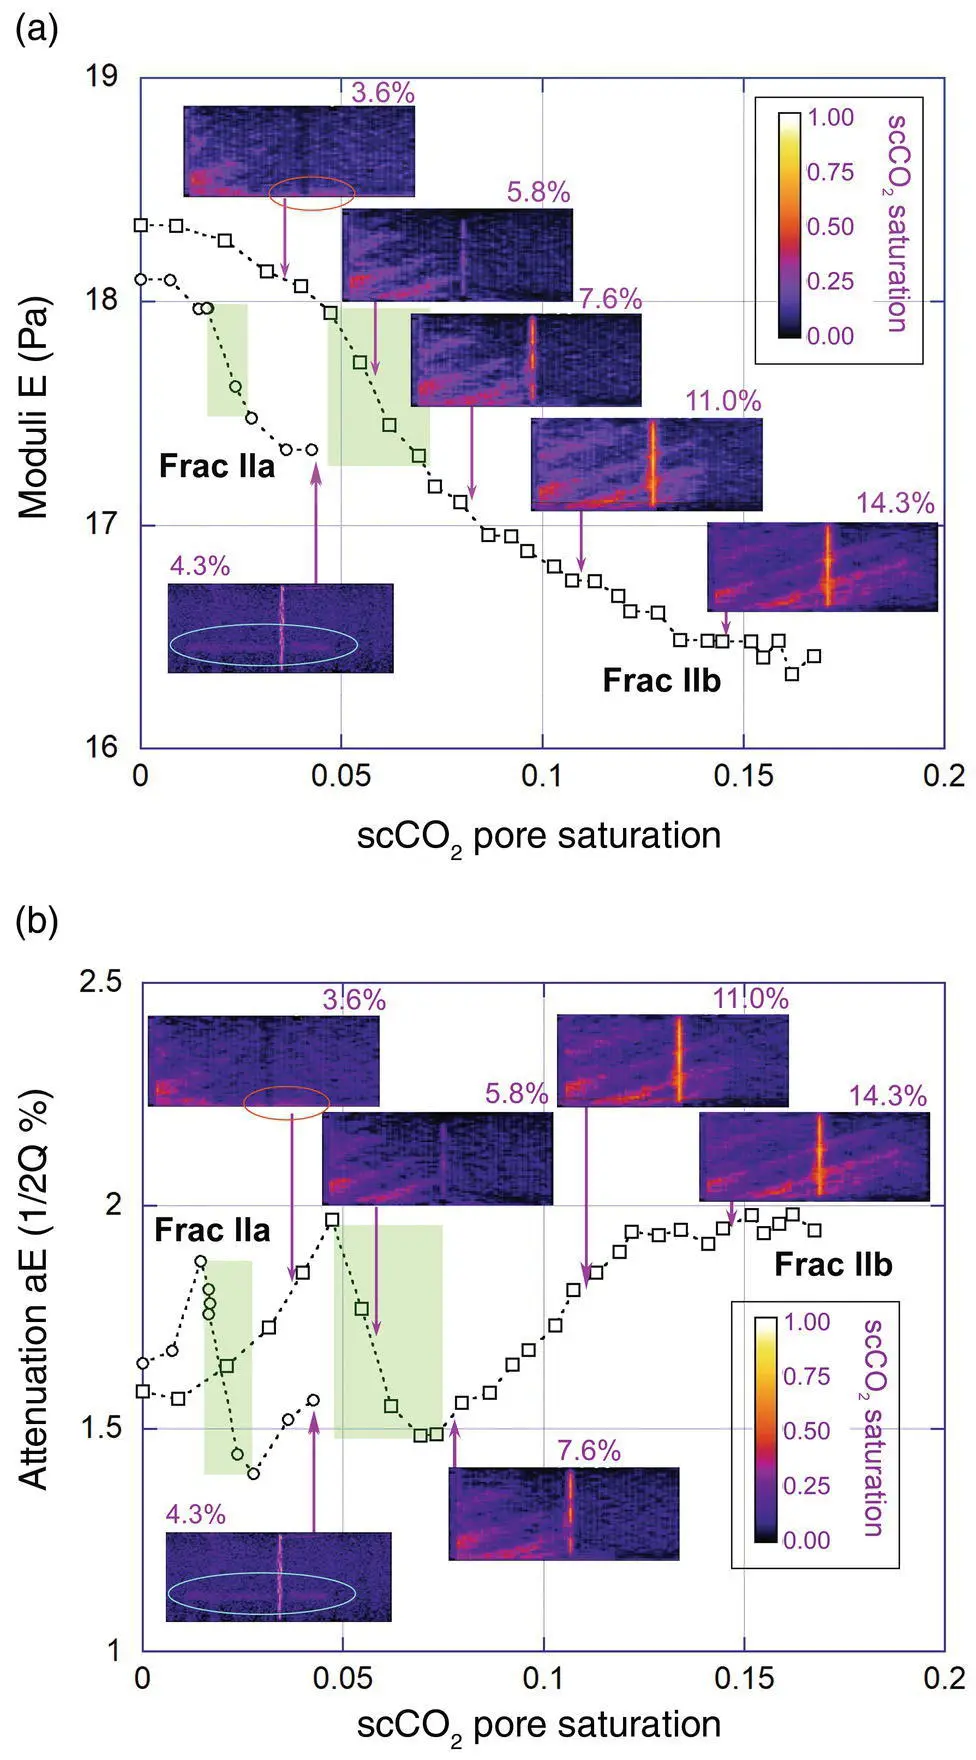
Figure 5.9 Young's modulus E and its related attenuation a Ecompared with the scCO 2distribution in Frac IIa and Frac IIb cores. The maximum decreases in E occur when scCO 2reaches the fracture but before the saturation in the adjacent rock matrix becomes high. Attenuation also drops abruptly at the same time. Green boxes indicate the responses due to possible relaxation of the fractures resulting from the invasion of scCO 2. However, the attenuation starts to recover as more scCO 2saturates the fracture and the rock matrix. Red oval indicates artifacts due to CT image registration errors. Blue oval indicates fast passing of scCO 2along a Mylar sheet, mimicking the behavior of a highly permeable sedimentary layer or a core‐parallel fracture in the sample: (a) Young's modulus and (b) Young's modulus attenuation.
(5.13) 
Интервал:
Закладка:
Похожие книги на «Geophysical Monitoring for Geologic Carbon Storage»
Представляем Вашему вниманию похожие книги на «Geophysical Monitoring for Geologic Carbon Storage» списком для выбора. Мы отобрали схожую по названию и смыслу литературу в надежде предоставить читателям больше вариантов отыскать новые, интересные, ещё непрочитанные произведения.


Обсуждение, отзывы о книге «Geophysical Monitoring for Geologic Carbon Storage» и просто собственные мнения читателей. Оставьте ваши комментарии, напишите, что Вы думаете о произведении, его смысле или главных героях. Укажите что конкретно понравилось, а что нет, и почему Вы так считаете.