Geophysical Monitoring for Geologic Carbon Storage
Здесь есть возможность читать онлайн «Geophysical Monitoring for Geologic Carbon Storage» — ознакомительный отрывок электронной книги совершенно бесплатно, а после прочтения отрывка купить полную версию. В некоторых случаях можно слушать аудио, скачать через торрент в формате fb2 и присутствует краткое содержание. Жанр: unrecognised, на английском языке. Описание произведения, (предисловие) а так же отзывы посетителей доступны на портале библиотеки ЛибКат.

- Название:Geophysical Monitoring for Geologic Carbon Storage
- Автор:
- Жанр:
- Год:неизвестен
- ISBN:нет данных
- Рейтинг книги:4 / 5. Голосов: 1
-
Избранное:Добавить в избранное
- Отзывы:
-
Ваша оценка:
Geophysical Monitoring for Geologic Carbon Storage: краткое содержание, описание и аннотация
Предлагаем к чтению аннотацию, описание, краткое содержание или предисловие (зависит от того, что написал сам автор книги «Geophysical Monitoring for Geologic Carbon Storage»). Если вы не нашли необходимую информацию о книге — напишите в комментариях, мы постараемся отыскать её.
Geophysical Monitoring for Geologic Carbon Storage
Volume highlights include: Geophysical Monitoring for Geologic Carbon Storage
The American Geophysical Union promotes discovery in Earth and space science for the benefit of humanity. Its publications disseminate scientific knowledge and provide resources for researchers, students, and professionals.
Geophysical Monitoring for Geologic Carbon Storage — читать онлайн ознакомительный отрывок
Ниже представлен текст книги, разбитый по страницам. Система сохранения места последней прочитанной страницы, позволяет с удобством читать онлайн бесплатно книгу «Geophysical Monitoring for Geologic Carbon Storage», без необходимости каждый раз заново искать на чём Вы остановились. Поставьте закладку, и сможете в любой момент перейти на страницу, на которой закончили чтение.
Интервал:
Закладка:
The total stress in the radial directions ( τ n, τ 11, and τ 22) and the wave‐induced relative fluid displacement (Darcy flux) in the axial direction ( w 3) is zero. By introducing these values and equations (5.5)– (5.7)into equations (5.3)and (5.4), we can eliminate all the variables in the ratio between the total stress τ 33and the axial strain u 3, 3= ε 33. This ratio, the core‐parallel Young's modulus E para, is given by
(5.8) 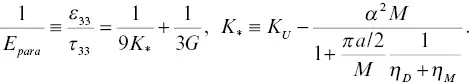
Note that this indicates that large fracture compliances result in K *→ K U− α 2 M = K D, that is, E para→ E D(drained Young's modulus). In contrast, when the fracture compliances are very small, K *→ K Uand E para→ E U(undrained Young's modulus). What this equation reveals is that for large drained normal fracture compliance η D, substitution of fluids within the fracture, which increases η M, may not result in significant changes in the Young's modulus.
Next, we examine the case when a core contains a fracture perpendicular to the axis. The conservation of fluid mass requires
(5.9) 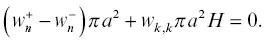
Also, the total stress and Darcy flux in the radial directions ( τ 11, τ 22, w 1, w 2) are zero, and τ 33= τ n. Similar to the core‐parallel case, using equations ( 5.3) through ( 5.6)and equation (5.9), the total stress τ 33and the total axial strain in the sample  can be related, after somewhat lengthy manipulations, via
(5.10) 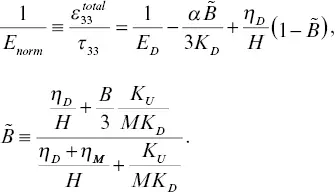
Note that  is a Skempton‐coefficient‐like parameter, providing the ratio between − p fand τ 33. Also, the effect of fluid substitution in the fractured core affects the effective Young's modulus only through this parameter. Small fracture compliances result in
 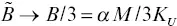 , that is, E norm→ E U(undrained Young's modulus). Large drained fracture compliance results in
 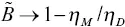 . Therefore,
(5.11) 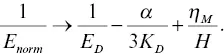
Equation (5.11)indicates, in contrast with the fracture parallel to the core axis, η Mcan still have an impact on the Young's modulus of the entire core sample.
Figure 5.8a and b shows predictions for the Young's modulus of the fractured samples during scCO 2injection, based upon equations (5.8)and (5.10), respectively, for a range of η Dvalues. Based upon the CT images of scCO 2distribution from the experiment, the substitution of the fluids was assumed only for the fracture by changing η Mas a function of the scCO 2saturation of the entire core. In contrast, for Figure 5.9, the substitution was assumed to happen throughout the sample. The poroelastic parameters of the rock were evaluated from the experimentally determined undrained Young's modulus and shear modulus of the rock at the beginning of the injection experiment, and a mineral bulk modulus of quartz was assumed ( K s= 38 GPa). Note that the experimentally determined dry elastic moduli were not used, because saturating the sandstone with water resulted in chemical softening of the rock matrix (both Young's and shear moduli decreased). Parameters used in the analysis are summarized in Table 5.2.
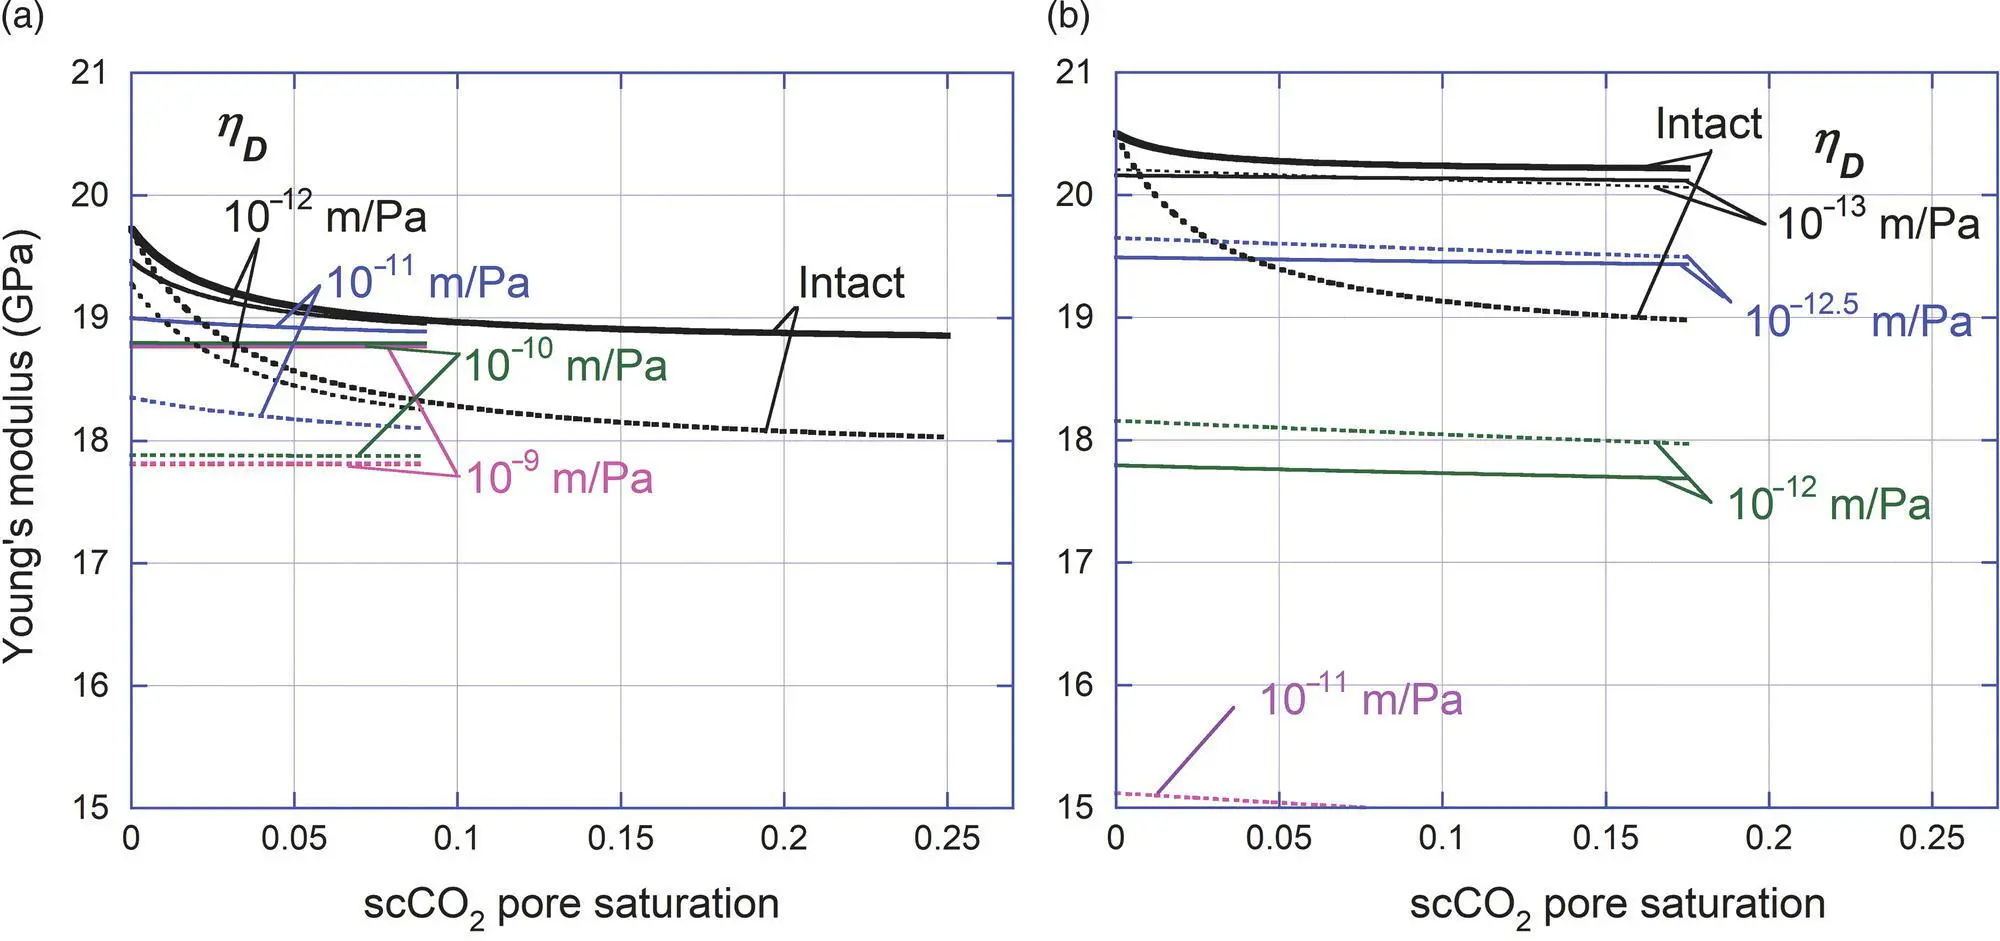
Figure 5.8 Fluid substitution modeling of the impact of fracture compliance using isotropic Gassmann models. Compare with the experimental results in Figure 5.5a and b. For (a) the core‐parallel fracture case, fluid substitution is assumed to happen only within the fracture. For (b) the core‐perpendicular case, it is assumed for the entire core. For better agreement between the models and the experiment, the shear modulus was slightly increased for the both cases, and the results are shown in dotted lines.
In Figure 5.8, qualitatively consistent with the experiment, large η Dresulted in Young's modulus values that did not depend upon the presence of scCO 2in the fracture. The model, however, does not show good quantitative agreement with the experiment, mostly underestimating the effect of the fracture and scCO 2injection. This may be attributed to the additional effect of compliant interfaces between the sample and the metal bars as mentioned earlier, but also to the use of an isotropic and homogeneous Gassmann model for representing possibly anisotropic rock. Particularly, small errors in the isotropic shear modulus can have a large impact on the fluid substitution. In Figure 5.8a, in broken lines, examples are shown for the case with a shear modulus, which is ~2% larger than the experimental value, resulting in better agreement of the Young's modulus values for the intact sample.
5.4.2. Frequency‐Dependent Fluid Pressure Diffusion Effect for Core‐Perpendicular Fracture Cases
Compared with the core‐parallel fracture case, the modeling results of the core‐perpendicular case are qualitatively different from the experiment ( Fig. 5.8b). Although the impact of the fluid substitution on the Young's modulus (through changes in the drained normal fracture compliance and the storage fracture compliance) is clearly seen, the model predicts much smoother and more monotonic changes than the experiment. (Note that, in Fig. 5.8b, similar to the core‐parallel case, assuming a larger shear modulus by 4.5% results in better predictions for the intact core case.) This is because equation 5.10assumes that reductions in the fluid bulk modulus by scCO 2injection occur throughout the sample (i.e., quasi‐static assumption). In reality, because of the finite frequency of the experiment, the effect of bulk fluid modulus reduction is limited by the fluid pressure diffusion length (the relative amplitude decays to e –1over the distance) in the water‐saturated part of the rock. This is given approximately by (e.g., Pride, 2003)
(5.12) 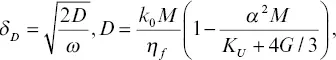
where k 0is the static permeability of the rock (34.5 md) and η fis the fluid viscosity (0.47 cP). For a frequency of 1.5 kHz and the material properties in Table 5.2, δ Dis computed as 12.5 mm (Carbon Tan #1 core) and 13.6 mm (Carbon Tan #2 core).
Читать дальшеИнтервал:
Закладка:
Похожие книги на «Geophysical Monitoring for Geologic Carbon Storage»
Представляем Вашему вниманию похожие книги на «Geophysical Monitoring for Geologic Carbon Storage» списком для выбора. Мы отобрали схожую по названию и смыслу литературу в надежде предоставить читателям больше вариантов отыскать новые, интересные, ещё непрочитанные произведения.


Обсуждение, отзывы о книге «Geophysical Monitoring for Geologic Carbon Storage» и просто собственные мнения читателей. Оставьте ваши комментарии, напишите, что Вы думаете о произведении, его смысле или главных героях. Укажите что конкретно понравилось, а что нет, и почему Вы так считаете.