Stephen J. Bourke - Respiratory Medicine
Здесь есть возможность читать онлайн «Stephen J. Bourke - Respiratory Medicine» — ознакомительный отрывок электронной книги совершенно бесплатно, а после прочтения отрывка купить полную версию. В некоторых случаях можно слушать аудио, скачать через торрент в формате fb2 и присутствует краткое содержание. Жанр: unrecognised, на английском языке. Описание произведения, (предисловие) а так же отзывы посетителей доступны на портале библиотеки ЛибКат.
- Название:Respiratory Medicine
- Автор:
- Жанр:
- Год:неизвестен
- ISBN:нет данных
- Рейтинг книги:4 / 5. Голосов: 1
-
Избранное:Добавить в избранное
- Отзывы:
-
Ваша оценка:
Respiratory Medicine: краткое содержание, описание и аннотация
Предлагаем к чтению аннотацию, описание, краткое содержание или предисловие (зависит от того, что написал сам автор книги «Respiratory Medicine»). Если вы не нашли необходимую информацию о книге — напишите в комментариях, мы постараемся отыскать её.
, a team of distinguished physicians delivers a comprehensive and accessible overview of the essentials of respiratory medicine, including a review of respiratory anatomy and physiology, as well as the aetiology, epidemiology, symptoms, and management of a wide range of respiratory diseases.
This edition offers self-assessment exercises in each chapter and a range of clinical images and scans showing the critical features of each disease. The book also offers:
A thorough introduction to history taking, examination, and investigations Comprehensive explorations of respiratory diseases, including upper respiratory tract infections and influenza, pneumonia, and tuberculosis Practical discussions of bronchiectasis, lung abscess, cystic fibrosis, asthma, and chronic obstructive pulmonary disease In-depth examinations of lung transplantation A companion website featuring figures, key points, and interactive self-assessment questions Perfect for medical students and respiratory nurses,
will also earn a place in the libraries of early-career medical doctors and residents with an interest in respiratory medicine.
Respiratory Medicine — читать онлайн ознакомительный отрывок
Ниже представлен текст книги, разбитый по страницам. Система сохранения места последней прочитанной страницы, позволяет с удобством читать онлайн бесплатно книгу «Respiratory Medicine», без необходимости каждый раз заново искать на чём Вы остановились. Поставьте закладку, и сможете в любой момент перейти на страницу, на которой закончили чтение.
Интервал:
Закладка:
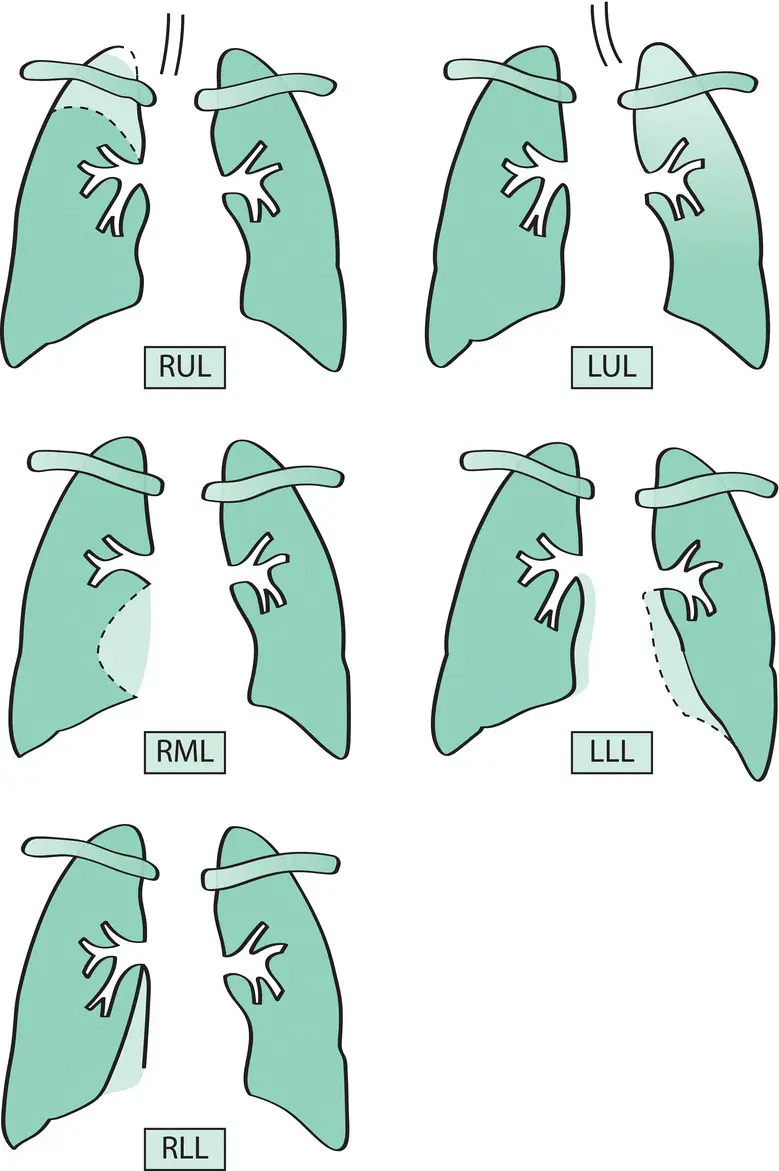
Figure 4.3 Radiographic patterns of lobar collapse. Collapsed lobes occupy a surprisingly small volume and are commonly overlooked on the chest X‐ray. Helpful information may be provided by the position of the trachea, the hilar vascular shadows and the horizontal fissure. LLL, left lower lobe; LUL, left upper lobe; RLL, right lower lobe; RML, right middle lobe; RUL, right upper lobe.
Cavitation
Cavitation is the presence of an area of radiolucency within a mass lesion. It is a feature of bronchial carcinoma(particularly squamous carcinoma) ( Fig. 4.8), tuberculosis, lung abscess, pulmonary infarcts, granulomatosis with polyangiitis (GPA)and some pneumonias(e.g. Staphylococcus aureus , Klebsiella pneumoniae ).
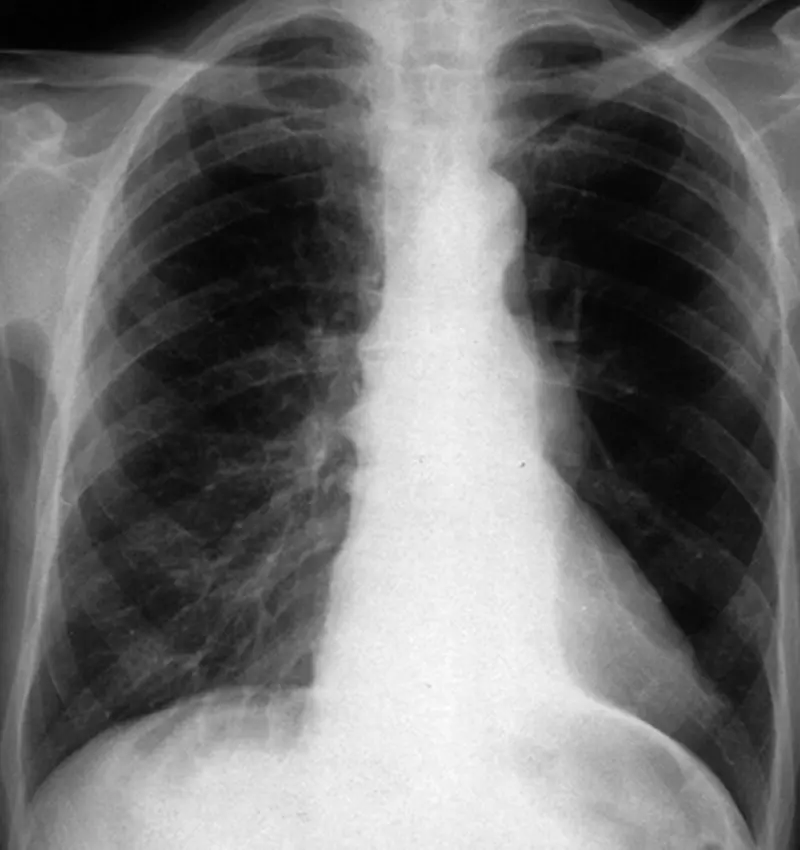
Figure 4.4 Left lower lobe collapse. The left lower lobe has collapsed medially and posteriorly and appears as a dense white triangular area behind the heart close to the mediastinum. The remainder of the left lung appears hyperlucent because of compensatory expansion. Bronchoscopy showed an adenocarcinoma occluding the left lower lobe bronchus.
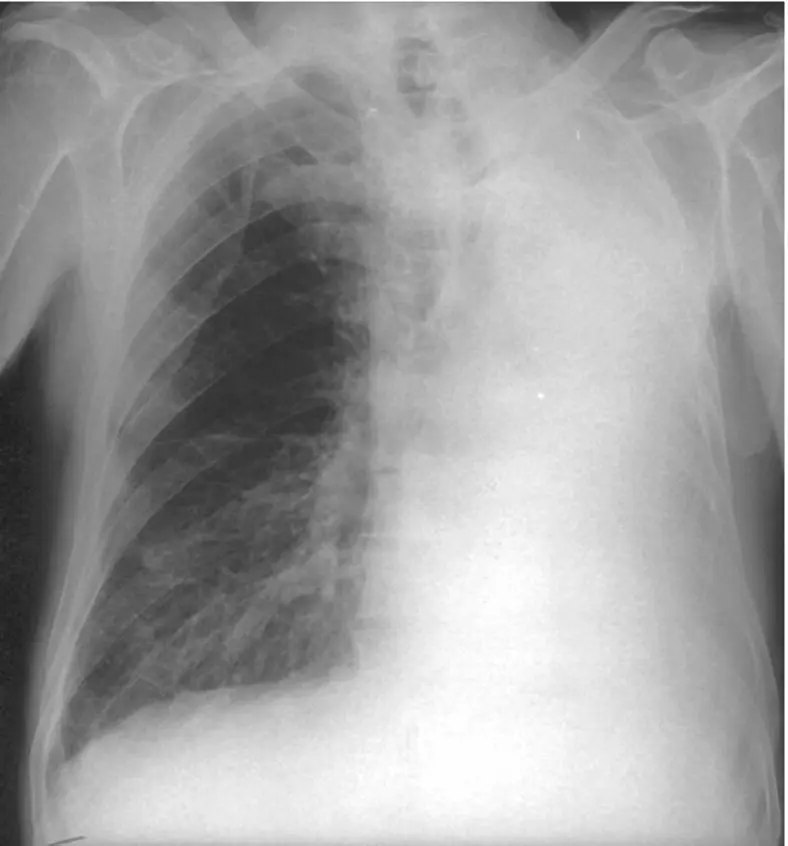
Figure 4.5 Left lung collapse. There is complete opacification of the left hemithorax with shift of the mediastinum to the left. Bronchoscopy showed a small cell carcinoma occluding the left main bronchus.
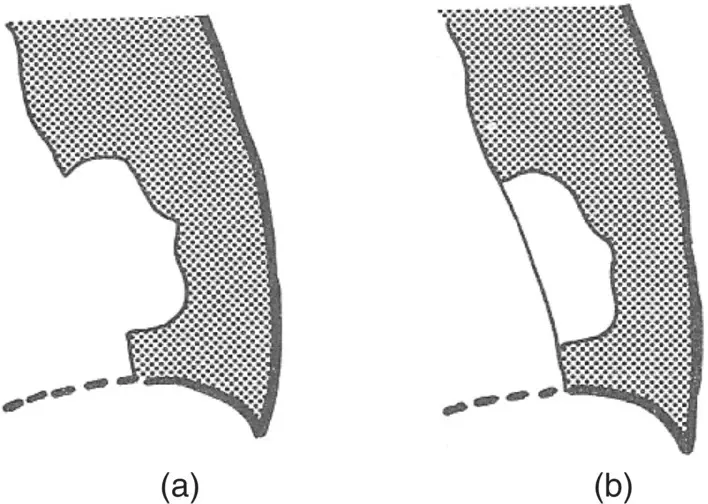
Figure 4.6 The silhouette sign, showing abnormal lung shadowing in the left lower zone. Where the sharp outline of mediastinal structures or diaphragm is lost because of normal lung opacification, it can be concluded that the shadow is immediately adjacent to the structure (and vice versa). In example (a), the shadow must be anterior and next to the heart as the sharp outline of the heart is lost. In (b), it must be posterior, as the heart outline is preserved.
Table 4.1 Causes of pulmonary masses
| Neoplastic Primary bronchial carcinomaMetastatic carcinomaBenign tumours (hamartoma) |
| Non‐neoplastic TuberculomaLung abscessHydatid cystPulmonary infarctArteriovenous malformationEncysted interlobar effusion (‘pseudotumour’)Rheumatoid nodule |
Fibrosis
Localised fibrosis produces streaky shadowswith evidence of tractionupon neighbouring structures. Upper lobe fibrosis causes traction upon the trachea and elevation of the hilar vascular shadows. Generalised interstitial fibrosis produces a hazy shadowing with a fine reticular (net‐like)or nodular pattern(see Chapter 13). Advanced interstitial fibrosis results in a honeycomb pattern with diffuse opacification containing multiple circular translucencies a few millimetres in diameter.
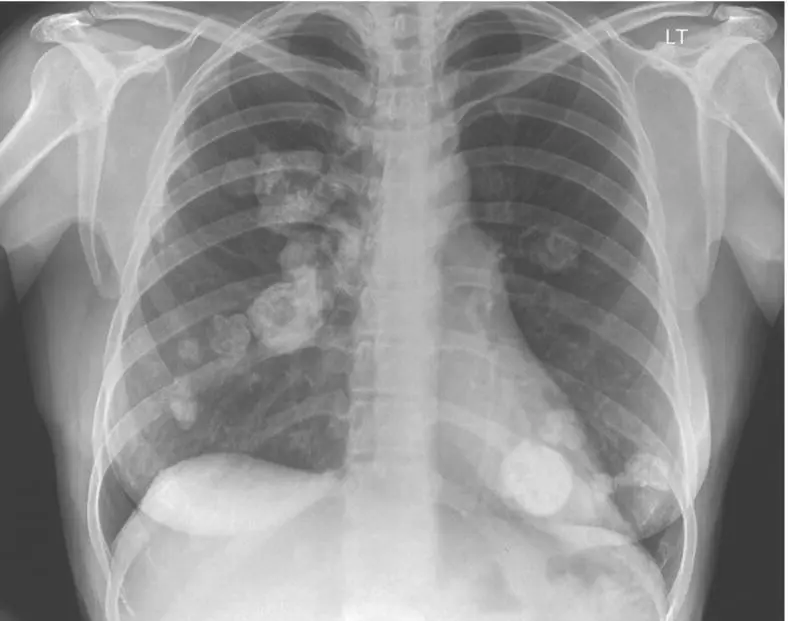
Figure 4.7 Chest X‐ray showing multiple partially calcified rounded masses in both lungs due to benign chondromas.
Mediastinal masses
Metastatic tumour or lymphomatous involvement of the mediastinal lymph nodes are the most common causes of mediastinal masses but there are a number of other diseases that may cause mediastinal masses ( Fig. 4.9). Thymic tumours, thyroid masses and dermoid cysts are most commonly situated in the anterior mediastinum whereas neural lesions (e.g. neurofibroma) and oesophageal cysts are often situated posteriorly. Aneurysmal enlargement of the aorta or ventricle may produce masses in the middle compartment of the mediastinum. CT scans are helpful in delineating the anatomy of mediastinal lesions. Thoracotomy with surgical excision is often necessary.
Ultrasonography of the chest
Normal air‐filled lung does not transmit high‐frequency sound waves so that ultrasonography is not useful in assessing disease of lung parenchyma. It is helpful in assessing lesions of the pleura and is particularly useful for localising loculated pleural effusions and guiding chest tube insertion (see Chapter 16).
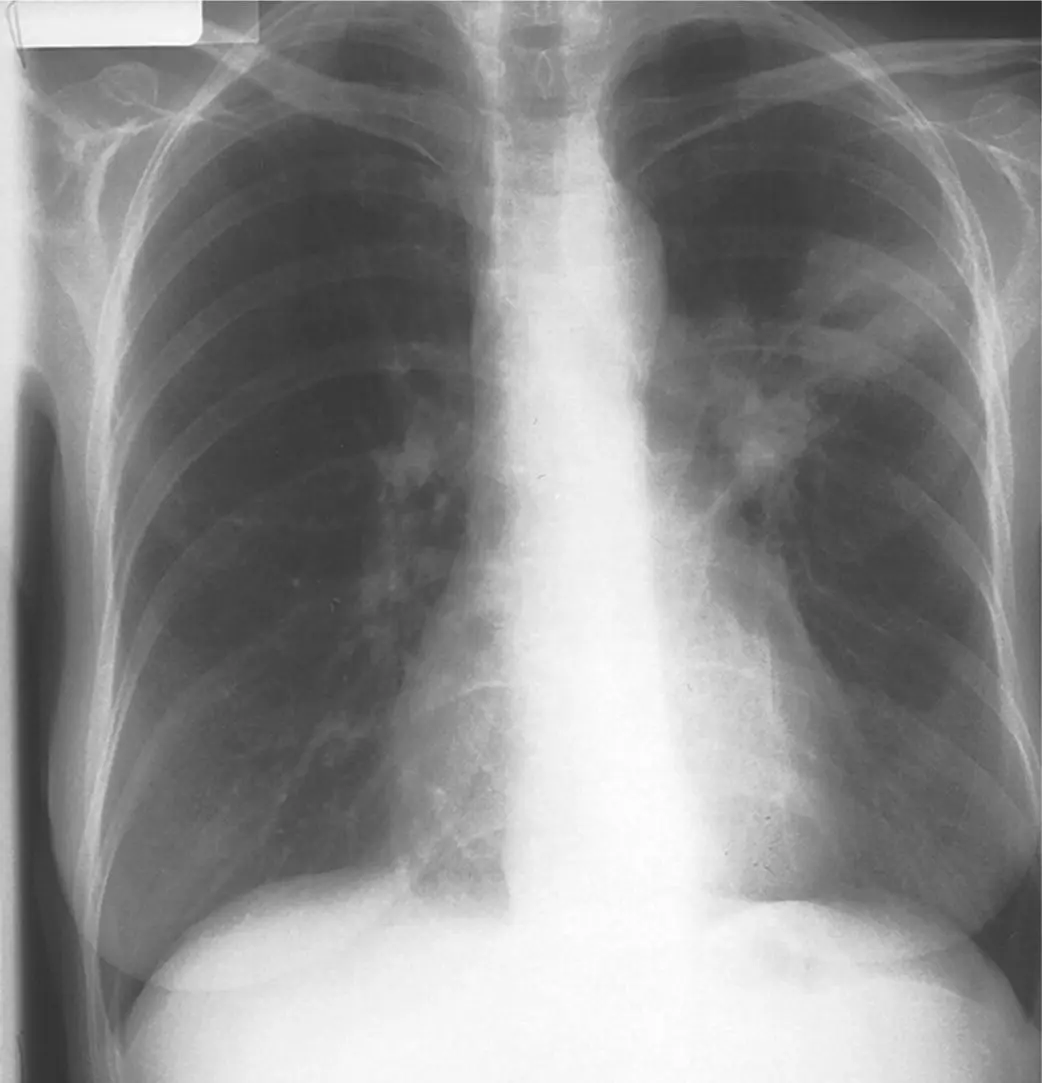
Figure 4.8 A cavitating lesion in the left upper lobe. A cavity appears as an area of radiolucency (black) within an opacity (white). Sputum cytology showed cells from a squamous carcinoma. Computed tomography showed left hilar and subcarinal lymphadenopathy.
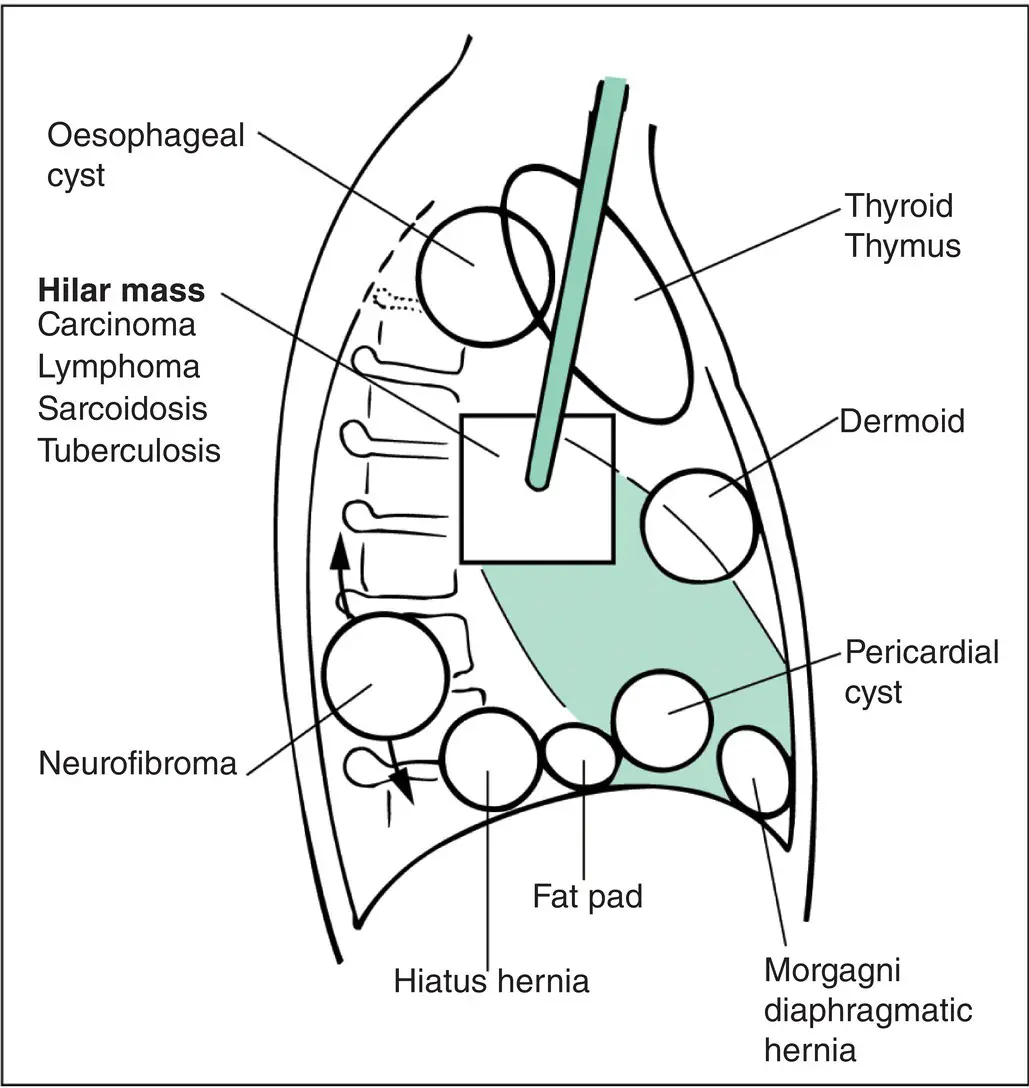
Figure 4.9 Mediastinal masses. Diagram of lateral view of the chest, indicating the sites favoured by some of the more common mediastinal masses.
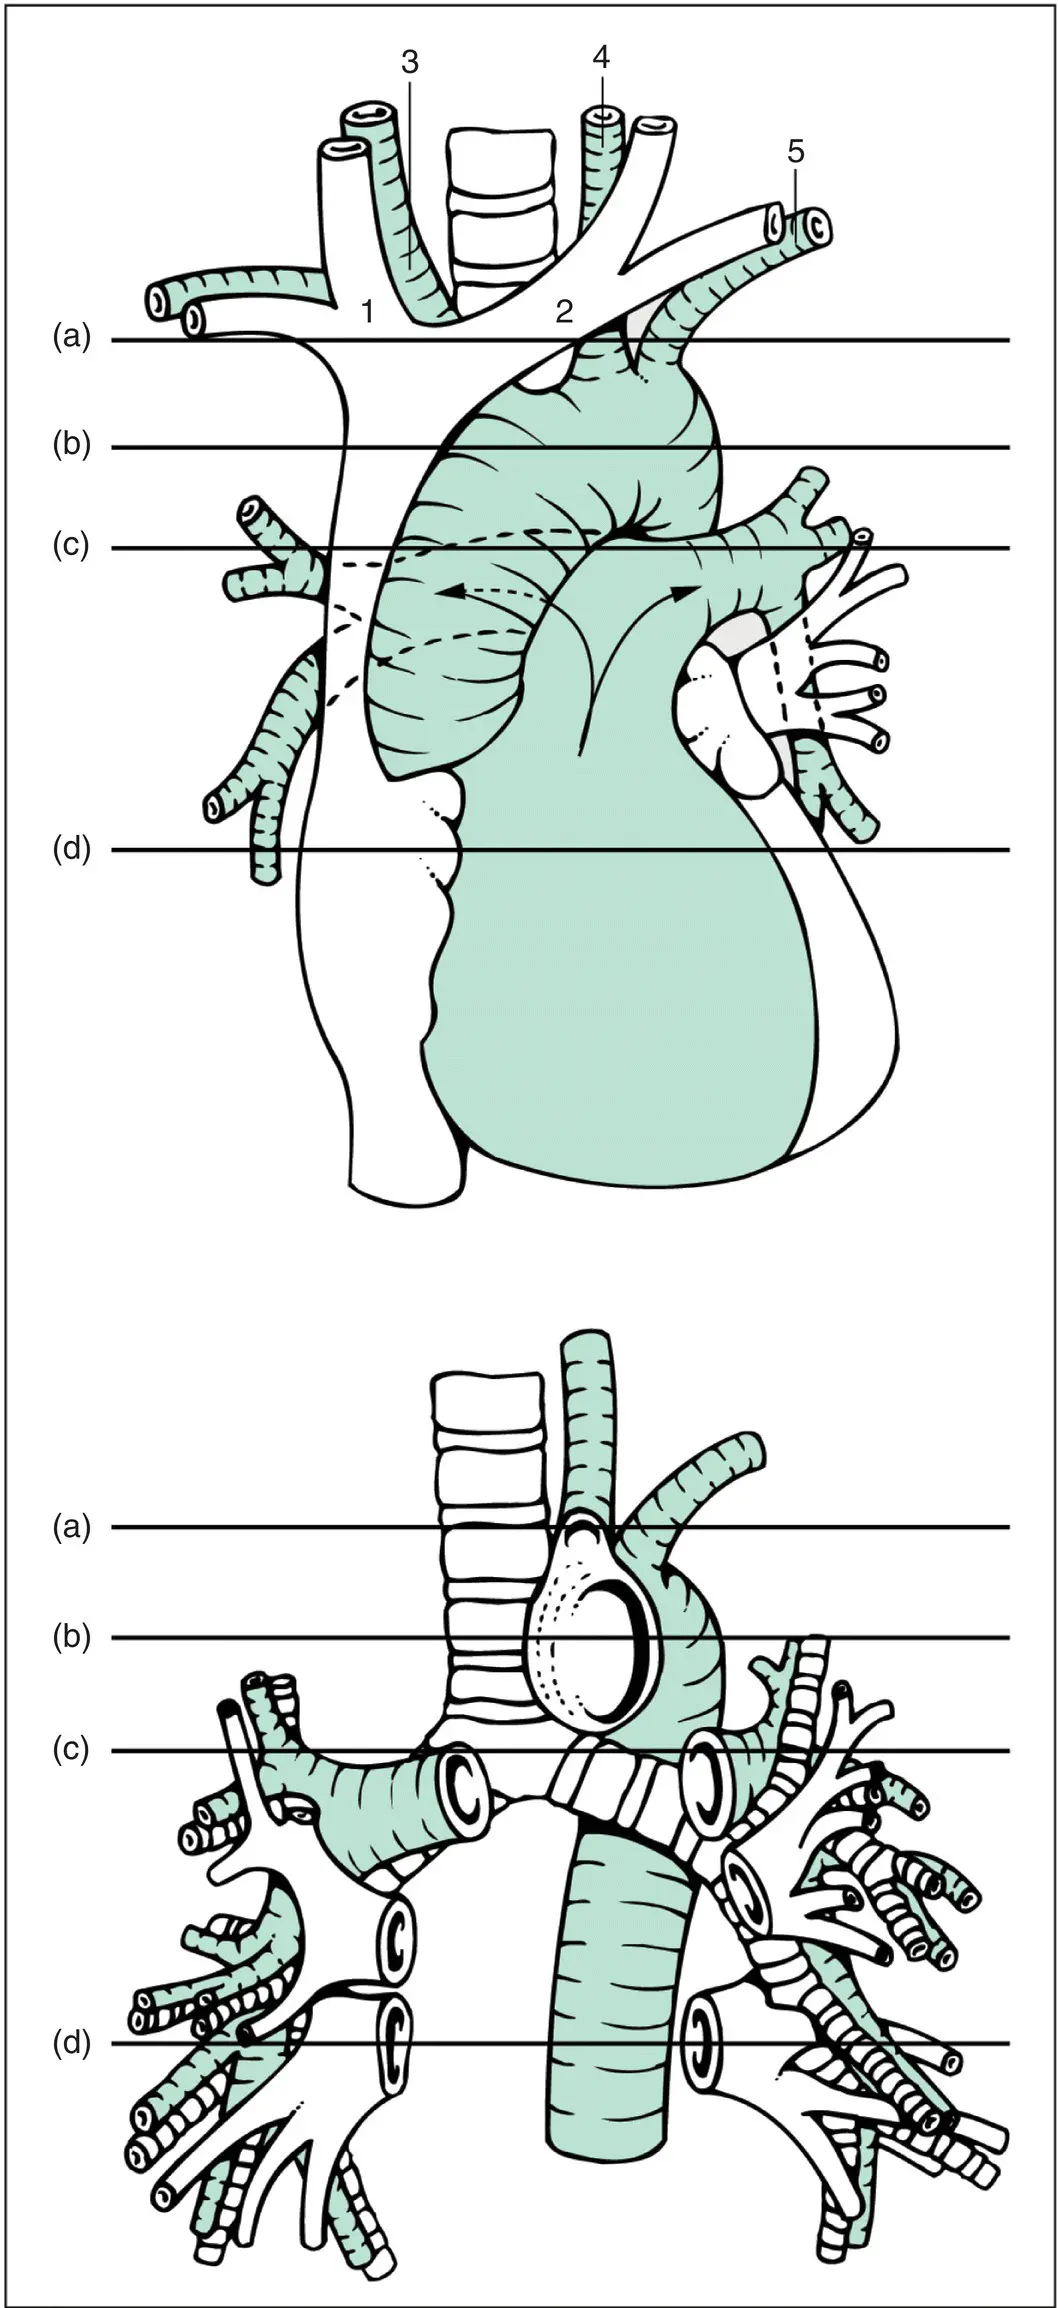
Figure 4.10 Mediastinal structures.Principal blood vessels and airways. Top: Heart and major blood vessels showing the aorta curling over the bifurcation of the pulmonary trunk into left and right pulmonary arteries (arrows). The horizontal lines (a)–(d) indicate the levels of the computed tomography sections illustrated in Fig. 4.10. 1, Right brachiocephalic vein; 2, left brachiocephalic vein; 3, innominate or brachiocephalic artery; 4, left common carotid artery; 5, left subclavian artery. Bottom: Structures with the heart removed. The aorta curls over the left main bronchus, which lies behind the left pulmonary artery. Pulmonary arteries are shown shaded, pulmonary veins unshaded and bronchi are shown striped. In general the arteries loop downwards, like a handlebar moustache; veins radiate towards a lower common destination – the left atrium. The veins are applied to the front of the arteries and bronchi and take a slightly different path to the respective lung segments. On the right, the order of structures from front to back is vein–artery–bronchus; on the left, the pulmonary artery loops over the left upper lobe bronchus and descends behind so that the order is vein–bronchus–artery.
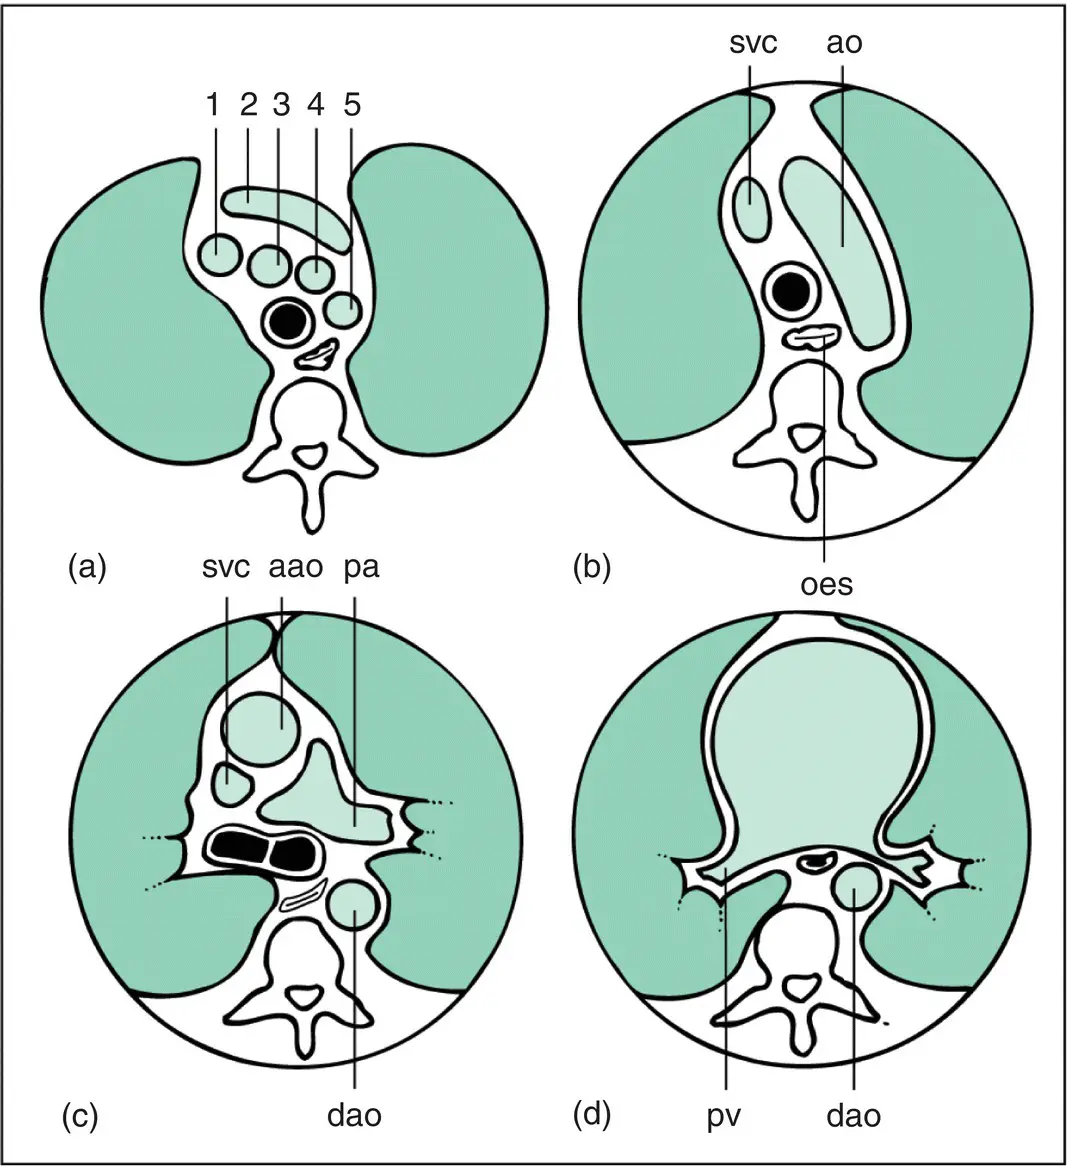
Figure 4.11 Principal mediastinal structures on computed tomography. The sections (a)–(d) are at levels (a)–(d) in Fig. 4.9. The sections should be regarded as being viewed from below (i.e. the left of the thorax is on the right of the figure). (a) Section above the aortic arch . Many large vessels and an anterior sausage shape are seen; the trachea has not bifurcated (black circle). Numerals refer to Fig. 4.9and its legend. (b) Section at the level of aortic arch . A large oblique sausage shape representing the aortic arch is seen (ao); oes, oesophagus which is visible in all the sections; svc, superior vena cava. (c) Section below the aortic arch . Both ascending (aao) and descending (dao) aortas are visible, the trachea is bifurcating and the pulmonary arteries are seen; pa, left pulmonary artery. (d) Section at the level of pulmonary veins (pv) . Lower lobe intrapulmonary arteries and bronchi are not shown in the diagram.
Читать дальшеИнтервал:
Закладка:
Похожие книги на «Respiratory Medicine»
Представляем Вашему вниманию похожие книги на «Respiratory Medicine» списком для выбора. Мы отобрали схожую по названию и смыслу литературу в надежде предоставить читателям больше вариантов отыскать новые, интересные, ещё непрочитанные произведения.


Обсуждение, отзывы о книге «Respiratory Medicine» и просто собственные мнения читателей. Оставьте ваши комментарии, напишите, что Вы думаете о произведении, его смысле или главных героях. Укажите что конкретно понравилось, а что нет, и почему Вы так считаете.