Stephen J. Bourke - Respiratory Medicine
Здесь есть возможность читать онлайн «Stephen J. Bourke - Respiratory Medicine» — ознакомительный отрывок электронной книги совершенно бесплатно, а после прочтения отрывка купить полную версию. В некоторых случаях можно слушать аудио, скачать через торрент в формате fb2 и присутствует краткое содержание. Жанр: unrecognised, на английском языке. Описание произведения, (предисловие) а так же отзывы посетителей доступны на портале библиотеки ЛибКат.
- Название:Respiratory Medicine
- Автор:
- Жанр:
- Год:неизвестен
- ISBN:нет данных
- Рейтинг книги:4 / 5. Голосов: 1
-
Избранное:Добавить в избранное
- Отзывы:
-
Ваша оценка:
Respiratory Medicine: краткое содержание, описание и аннотация
Предлагаем к чтению аннотацию, описание, краткое содержание или предисловие (зависит от того, что написал сам автор книги «Respiratory Medicine»). Если вы не нашли необходимую информацию о книге — напишите в комментариях, мы постараемся отыскать её.
, a team of distinguished physicians delivers a comprehensive and accessible overview of the essentials of respiratory medicine, including a review of respiratory anatomy and physiology, as well as the aetiology, epidemiology, symptoms, and management of a wide range of respiratory diseases.
This edition offers self-assessment exercises in each chapter and a range of clinical images and scans showing the critical features of each disease. The book also offers:
A thorough introduction to history taking, examination, and investigations Comprehensive explorations of respiratory diseases, including upper respiratory tract infections and influenza, pneumonia, and tuberculosis Practical discussions of bronchiectasis, lung abscess, cystic fibrosis, asthma, and chronic obstructive pulmonary disease In-depth examinations of lung transplantation A companion website featuring figures, key points, and interactive self-assessment questions Perfect for medical students and respiratory nurses,
will also earn a place in the libraries of early-career medical doctors and residents with an interest in respiratory medicine.
Respiratory Medicine — читать онлайн ознакомительный отрывок
Ниже представлен текст книги, разбитый по страницам. Система сохранения места последней прочитанной страницы, позволяет с удобством читать онлайн бесплатно книгу «Respiratory Medicine», без необходимости каждый раз заново искать на чём Вы остановились. Поставьте закладку, и сможете в любой момент перейти на страницу, на которой закончили чтение.
Интервал:
Закладка:
Pulmonary function tests should not be interpreted in isolation and should be considered in the context of all additional information concerning the patient.
In this chapter, we will look at:
simple tests of ventilatory function
tests of gas transfer
arterial blood gases.
Simple tests of ventilatory function
Ventilationrefers to the process of moving air in and out of the lungs.
Lung volumes
Fig. 3.1shows an overview of lung capacity and its subdivisions. The tidal volumeis the volume of air that enters and leaves the lungs during normal breathing. The volume of gas within the lungs at the end of a normal expiration is the functional residual capacity. The volume of gas in the lungs after a full inspiration is the total lung capacity(TLC). After a full expiration, there will still be some gas remaining in the lungs: the residual volume. Vital capacity(VC) is the volume of air expelled by a full expiration from a position of full inspiration. VC and its subdivisions can be measured directly by spirometry, whereas measurements of residual volume and TLC require the use of gas dilution or plethysmography methods.
Spirometry
Spirometry is the most commonly used test of pulmonary function. It is a measurement of the amount (volume) and/or speed (flow) of air that can be exhaled. Traditionally, the result of this test is represented graphically as a plot of the volume of air exhaled against time during a forced expiratory manoeuvre: the forced expiratory spirogram( Fig. 3.2).
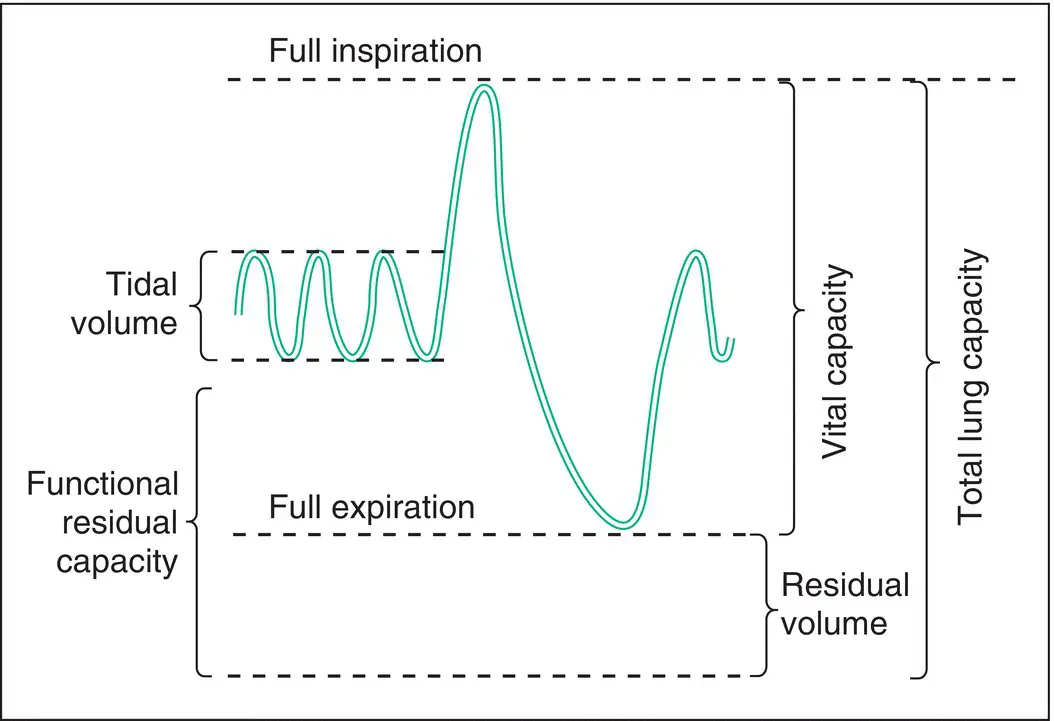
Figure 3.1 Total lung capacity and its subdivisions.
Vital capacity
Vital capacity is the volume of air expelled by a full expiration from a position of full inspiration. The patient is usually encouraged to exhale with maximum effort, referred to as forced vital capacity(FVC). VC may also be measured by a slow exhalation, sometimes referred to as ‘slow’ VC. In normal individuals, slow VC and FVC are very similar, but in patients with airway obstruction, air trapping occurs during forced expiration, so that the FVC may be significantly smaller than the slow VC. VC may be reduced by any condition that limits the lung’s ability to achieve a ‘full’ inspiration, such as:
reduced lung compliance (e.g. lung fibrosis, loss of lung volume)
chest deformity (e.g. kyphoscoliosis, ankylosing spondylitis)
muscle weakness (e.g. myopathy, myasthenia gravis).
It may also be reduced in chronic obstructive pulmonary disease (COPD), when air trapping causes increased residual volume.
Forced expiratory volume in 1 second and FEV 1:FVC ratio
The forced expiratory volume in 1 second (FEV 1) is the volume of air expelled in the first second of a maximal forced expiration from a position of full inspiration. It is reduced in any condition that reduces VC, but is particularly reduced when there is diffuse airway obstruction. In diffuse airway obstruction therefore, the ratio FEV 1 :FVCis lower than would be predicted in health. When interpreting results it is important to understand what normal is. During a forced expiratory manoeuvre, the proportion of air expelled in the first second varies with age. For people in their 20s that volume should be at least 85% of the total, while people in their 80s should be able to expel at least 70% in the first second.
When the ratio FEV 1 :FVCis reduced, this pattern is referred to as an obstructive defectand is most commonly seen in asthma and COPD. When lung volume is restricted (by, for example, reduced lung compliance chest deformity or muscle weakness), the VC and FEV 1are both reduced, roughly in proportion, so that the FEV 1:FVC ratio is essentially normal. This pattern of ventilatory impairment is referred to as a restrictive defect.
Maximal midexpiratory flow
In addition to FEV 1and FVC, a number of other indices may be calculated from a forced expiratory spirogram. The forced expiratory flow measured over the middle half of expiration ( FEF 25–75%) reflects changes in the smaller peripheral airways, whereas FEV 1and peak expiratory flow (PEF) particularly are predominantly influenced by diffuse changes in the medium‐sized and larger central airways, at least in health (see Chapter 1).
Peak expiratory flow
Peak expiratory flow is the maximum rate of airflow that can be achieved during a sudden forced expiration from a position of full inspiration. The best of three attempts is usually accepted as the peak flow rate. It is somewhat dependent on effort, but is mainly determined by the calibre of the airways, and is therefore an index of diffuse airway obstruction. Its principal advantage is derived from its portability and low cost ( Fig. 3.3). This allows multiple measurements to be performed independently by patients at different times and in different environments. Variability can thus be observed, which makes it useful in the diagnosis and monitoring of asthma (see Chapter 10).
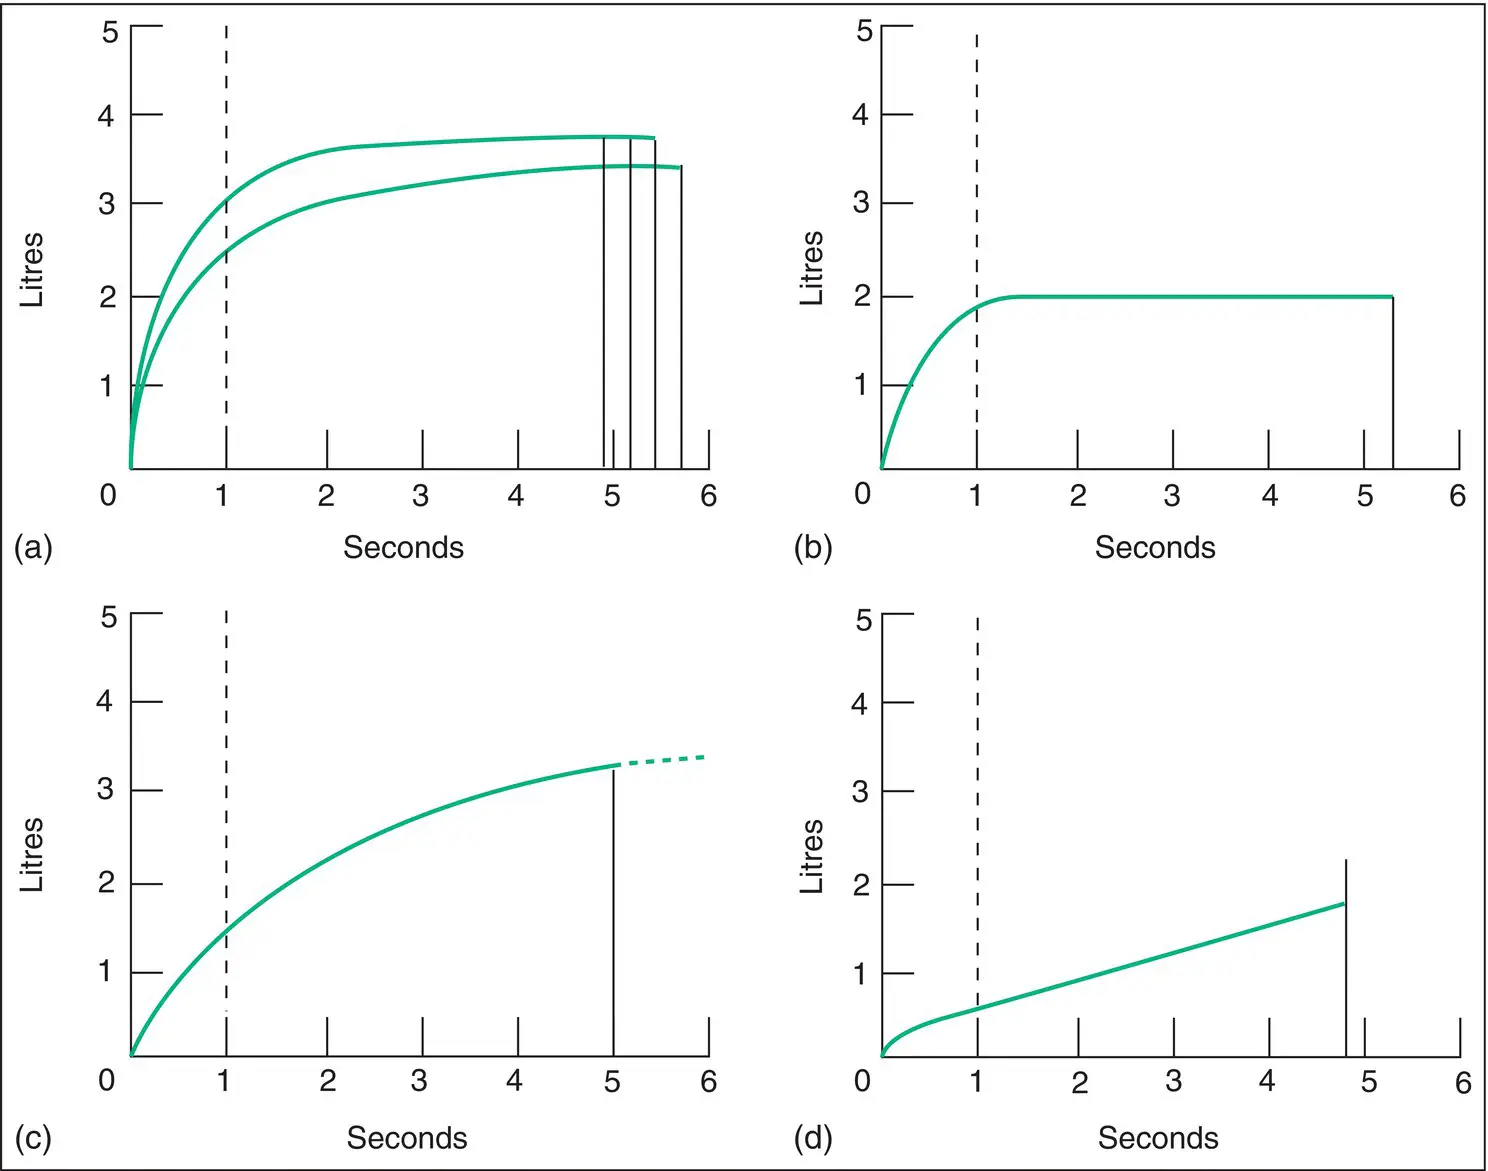
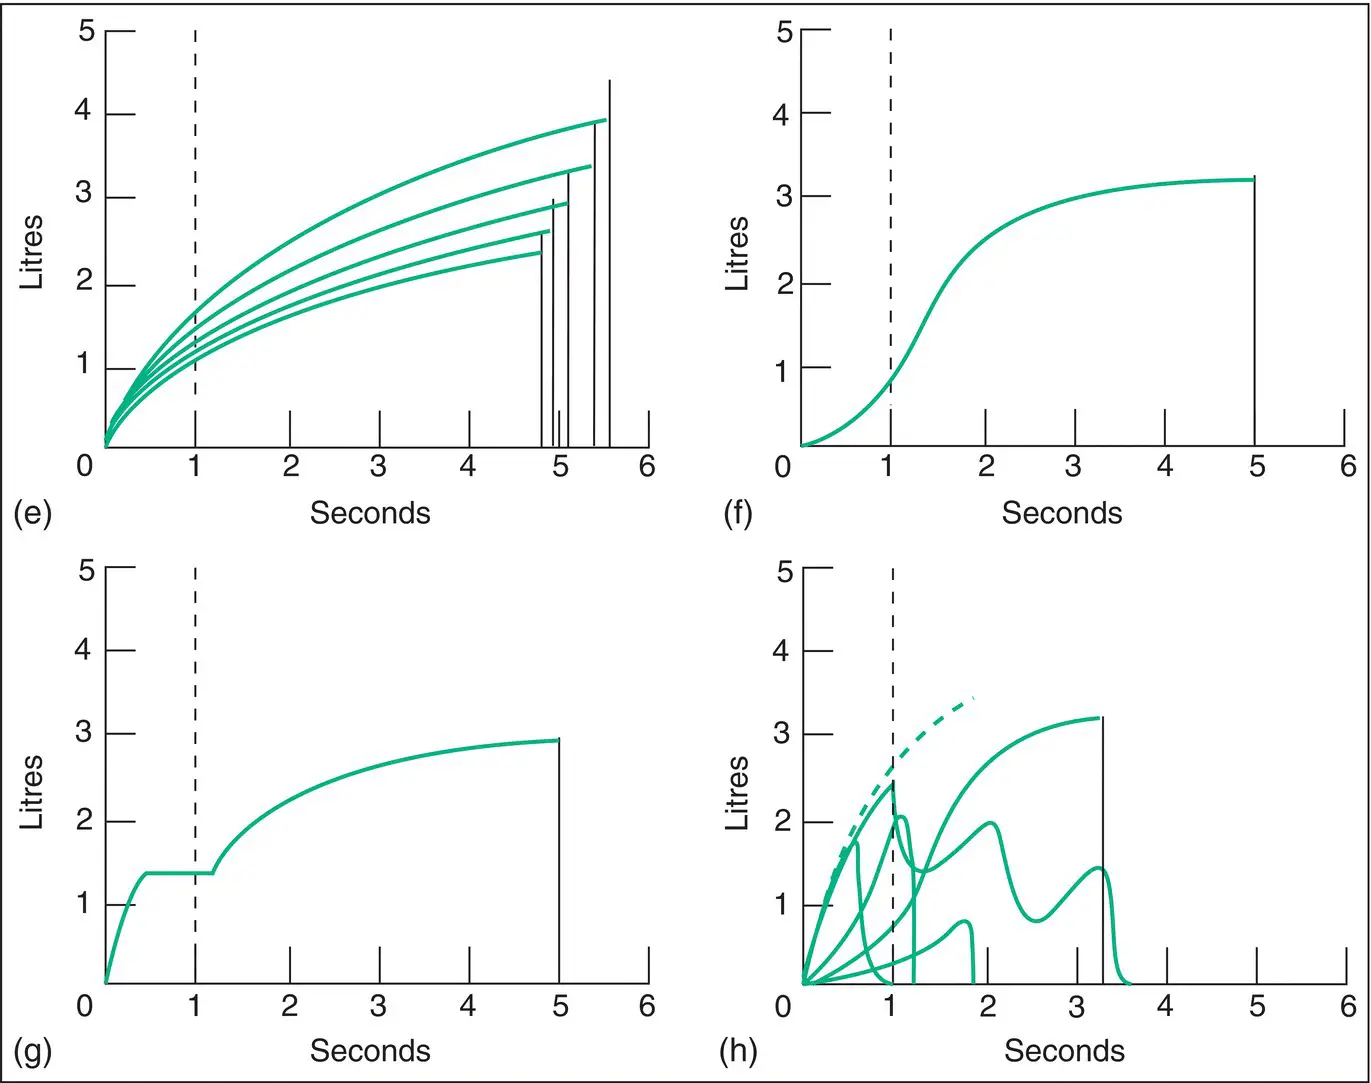
Figure 3.2 Forced expiratory spirogram tracing obtained with a spirometer. (a) Normal . Four expirations have been made. Three of these are true maximal forced expirations, as indicated by their reproducibility . The FEV 1is 3.2I and the FVC is 3.8I. The forced expiratory ratio (FEV 1:FVC) is 0.84. (b) Restrictive ventilatory defect . Patient with pulmonary fibrosis. The FVC in this case is 2I, less than the predicted value for the subject. The FEV 1is also reduced below the predicted value, but it represents a large part of the FVC. The forced expiratory ratio is >0.90. (c) Obstructive ventilatory defect . The FEV 1is much reduced. The rate of airflow is severely reduced, as indicated by the reduced slope of the curve. Note that the forced expiratory time is increased: the patient is still blowing out at 5 seconds. The VC has not been adequately recorded in this case, because the patient did not continue the expiration after 5 seconds; he or she could have expired further (this is a common technical error). (d) Severe airway obstruction . The FEV 1is about 0.5I. The FVC is also reduced, but not so strikingly as FEV 1. Forced expiratory ratio is 0.23. Very low expiratory flow rate. This pattern of a very brief initial rapid phase followed by a straight line indicating little change in maximal flow rate with change in lung volume used to be thought to be indicative of severe emphysema, although identical results can be observed in severe asthma. (e) Airway obstruction and bronchial hyperreactivity . Five expirations have been made. FEV 1and FVC become lower with each expiration. Patient with asthma. These features suggest poor control of asthma and liability to severe attacks. (f) A non‐maximal expiration . Compare with (a). In a true forced expiration, the steepest part of the curve always occurs at the beginning of expiration, which is not the case here. A falsely low FEV 1and forced expiratory ratio are obtained. Usually, the patient has not understood what is required or is unable to coordinate his or her actions. Some patients wish to appear worse than they really are. This pattern is unlikely to be mistaken for a true forced expiration because of its shape and because it cannot be reproduced repeatedly. (g) Escape of air from the nose or lips during expiration. (h) Inability to perform the manoeuvre . Five attempts have been made. In some, the patient has breathed in and out. Other attempts are either not maximal forced expirations or are unfinished. Bizarre patterns such as this are often seen in patients with psychogenic breathlessness or in the elderly. Even with poor cooperation, it is often possible to obtain useful information. In the example shown, significant airway obstruction can be excluded because of the steep slope of at least two of the expirations, which follow an identical course and show appropriate curvature (dotted line), and the FVC can be estimated as not less than 3.2I. The pattern seen in large airway obstruction is shown in Figs 3.5and 3.6.
Читать дальшеИнтервал:
Закладка:
Похожие книги на «Respiratory Medicine»
Представляем Вашему вниманию похожие книги на «Respiratory Medicine» списком для выбора. Мы отобрали схожую по названию и смыслу литературу в надежде предоставить читателям больше вариантов отыскать новые, интересные, ещё непрочитанные произведения.


Обсуждение, отзывы о книге «Respiratory Medicine» и просто собственные мнения читателей. Оставьте ваши комментарии, напишите, что Вы думаете о произведении, его смысле или главных героях. Укажите что конкретно понравилось, а что нет, и почему Вы так считаете.