Elizabeth May - Climate Change For Dummies
Здесь есть возможность читать онлайн «Elizabeth May - Climate Change For Dummies» — ознакомительный отрывок электронной книги совершенно бесплатно, а после прочтения отрывка купить полную версию. В некоторых случаях можно слушать аудио, скачать через торрент в формате fb2 и присутствует краткое содержание. Жанр: unrecognised, на английском языке. Описание произведения, (предисловие) а так же отзывы посетителей доступны на портале библиотеки ЛибКат.
- Название:Climate Change For Dummies
- Автор:
- Жанр:
- Год:неизвестен
- ISBN:нет данных
- Рейтинг книги:5 / 5. Голосов: 1
-
Избранное:Добавить в избранное
- Отзывы:
-
Ваша оценка:
Climate Change For Dummies: краткое содержание, описание и аннотация
Предлагаем к чтению аннотацию, описание, краткое содержание или предисловие (зависит от того, что написал сам автор книги «Climate Change For Dummies»). Если вы не нашли необходимую информацию о книге — напишите в комментариях, мы постараемся отыскать её.
allows you to investigate this hottest of hotly debated issues for yourself—examining its causes, the way it affects our lives, and what we can all do to make a difference.
This straightforward guide—cowritten by the former leader of Canada's Green Party and the Canadian Chief of Staff to the Minister of Natural Resources—sifts the fact from the fiction: Is climate change caused by human activity or by natural elements beyond our control? What contribution can clean energy make? What are our best and worst-case scenarios?
What are the likely long- and short-term effects? How can human activity can impact the environment? Can individuals and governments help reverse the possible effects? Which are the best sources of cleaner energy? With the IPCC predicting a 2.5–10°F warming over the next century, this complex subject will be making temperatures soar for years to come—on both sides of the debate.
is the ideal tool to navigate these increasingly choppy waters—and to make an informed difference where you can.
Climate Change For Dummies — читать онлайн ознакомительный отрывок
Ниже представлен текст книги, разбитый по страницам. Система сохранения места последней прочитанной страницы, позволяет с удобством читать онлайн бесплатно книгу «Climate Change For Dummies», без необходимости каждый раз заново искать на чём Вы остановились. Поставьте закладку, и сможете в любой момент перейти на страницу, на которой закончили чтение.
Интервал:
Закладка:
EL NIÑO: GLOBAL WARMING CAUSE, EFFECT, OR BOTH?
El Niño is a natural weather cycle that has the power to change global temperatures. It’s been around for hundreds — possibly millions — of years. El Niño involves the tropical Pacific Ocean warming by 0.9 degrees F (0.5 degrees C) or more for about three months at a time. This warmed water eventually loses that heat to the atmosphere, causing the average air temperature (at the surface, or where humanity lives in the lower part of the atmosphere) to go up a few months later, which then alters the overall climate temporarily. The temperature of the ocean then settles back down to normal and returns to its regular cycle of ups and downs.
Scientists don’t yet know whether global warming is affecting these cycles, but global warming and El Niño cycles are very interrelated. Part of the reason scientists can’t distinguish between the impacts of global warming and El Niño on climate is because they’re so linked and because they both influence many different aspects of regional climate that they can actually change one another. A computer model giving future scenarios of climate that includes both El Niño and global warming doesn’t yet exist because of the difficulty that exists between identifying the separations between the two.
Some models say El Niño will become stronger, but others say it’ll weaken. Evidence suggests that El Niño cycles have been stronger and happening more often over the past few decades, and climate models project that climate change will cause sea-surface temperatures to rise in the tropical Pacific Ocean — similar to El Niño conditions. Scientists are working constantly to advance their understanding of the relationship between climate change and El Niño.
Two unknown questions remain: How much temperature rise is the result of El Niño and how much is the result of global warming? Are El Niño temperatures any higher because of global warming?
Making the Case for Carbon
Scientists have collected evidence that confirms the buildup of carbon dioxide in the Earth’s atmosphere as by far the most likely cause of the current climate crisis. And they’ve built computer models to forecast future effects.
Geologic and prehistoric evidence
They can measure exactly how much carbon dioxide has been in the Earth’s atmosphere historically. Climatologists (scientists specializing in climate science) have drilled deep — as deep as 2 miles (3 kilometers) — into ancient ice in places such as Antarctica and Greenland. They’ve pulled up ice cores — long, thin samples of many layers of ice that has been packed down over thousands of years, which look like really (really) long pool noodles. (Figure 3-2 shows two scientists drilling for an ice core sample.) When the layers are clearly visible, the ice core looks like a pool noodle with horizontal stripes.
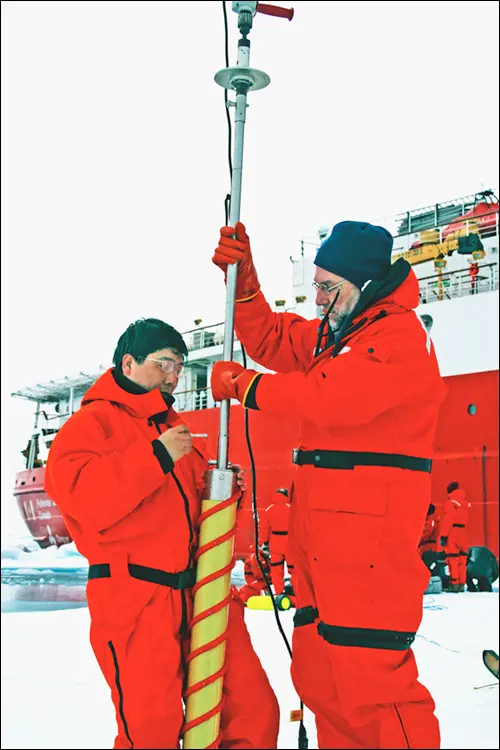
National Oceanic and Atmospheric Administration
FIGURE 3-2:Drilling for an ice core sample.
Scientists can date an ice core by counting the layers of ice — just like you can tell the age of a tree by counting its rings. The layers of ice tell them exactly when the ice was formed. Each layer of ice includes little pockets of trapped air. These frozen air bubbles are like time capsules of the ancient atmosphere. They’re full of gas, including carbon dioxide, that has been trapped for hundreds of thousands of years. Each layer of ice in the ice core also contains deuterium, a hydrogen isotope that enables scientists to determine what the temperature was when that ice layer was formed.
 An atmospheric temperature change of just 1.8 degree F (1 degree Celsius) leads to a change of 9 parts per million (ppm) in the amount of deuterium stored in the ice. By contrasting the ancient temperatures revealed through the analysis of the layer’s deuterium and carbon dioxide, scientists can glimpse the relationship between historical levels of carbon dioxide and temperature. The two run side-by-side almost like the lanes of a race track.
Scientists still don’t know the exact cause and effect relationship between GHGs and temperature throughout the planet’s history. The cause of the last ice age, for instance, probably wasn’t a drop in atmospheric carbon dioxide, but a result of the Earth tilting away from the sun in a phase in the planet’s Milankovitch cycle (which we discuss in the section “ Considering Causes of Global Warming Other Than GHGs,” earlier in this chapter). This cooling then spurred the atmosphere’s carbon dioxide to drop, and the two events in tandem brought about the ice age. Ultimately, scientists still aren’t sure whether temperature affects carbon dioxide, or whether carbon dioxide affects temperature — it’s a question of which came first, the chicken or the egg.
What scientists do know for certain is that a distinct pattern and relationship between carbon dioxide and temperature exists; when one is high, so is the other, and when one is low, the other plunges, too. Scientists also know that the Milankovitch cycle has little to do with climate change over the past 200 or 300 years. In that time, human-produced carbon dioxide levels have skyrocketed, and temperature is starting to follow. As a result, scientists are certain that human-produced GHGs are currently warming the Earth. This close relationship between GHG concentrations and temperature suggests these higher levels of carbon dioxide will cause temperatures to continue rising.
Figure 3-3 shows the historic connection between carbon dioxide concentrations and fluctuations in temperature, as captured in ice-core deuterium levels.
Modeling and forecasting
To look forward, scientists make climate models (a model in this case is a computer program) to simulate the functioning of the Earth’s atmosphere and climate. These models cover the atmosphere, oceans, land, and ice of the planet. Researchers input data about the climate and how it works, and then start modifying that data to create various alternative scenarios.
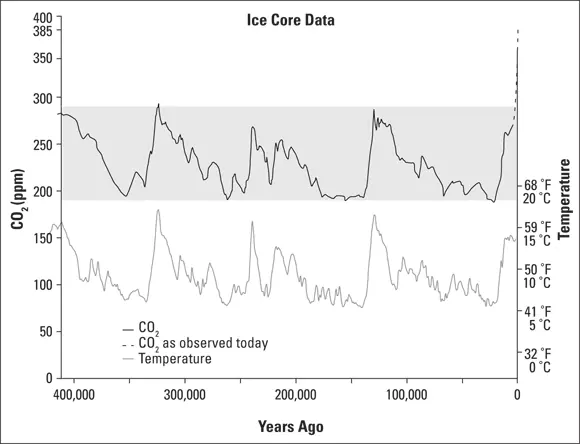
Source: National Oceanic and Atmospheric (NOAA). Vostok Ice Core data and Mauna Loa carbon dioxide observations. Graph: John Streicker.
FIGURE 3-3:GHG levels and temperature fluctuations over the past 420,000 years.
These models have been proven; they work. Even conservative financial newspapers not known for positive views on climate change admit that the models have been “largely correct” in indicating the future path. The models keep getting more comprehensive and detailed — now people can see with real clarity the effects of continuing to emit carbon into the atmosphere.
The modelers are able to look at what would happen if, say, temperatures went up by, say, 3.6 or even 10.8 degrees F (2 or 6 degrees C) above 1850 levels. (These temperature increases refer to the global average, which we discuss in the following section.) (See the “How climate models work” sidebar, in this chapter, for more information.)
In particular, the models show how sensitive the climate is to what may seem like very small changes in temperature.
HOW CLIMATE COMPUTER MODELS WORK
The climate is affected by both the atmosphere (the part that everyone talks about the most) and the oceans. Changes in the air happen quickly, and changes in the oceans happen very slowly. So, scientists have been able to study air changes relatively easily, but they have quite literally had to wait and see what happens to the oceans. And because the ocean actually affects the bulk of the climate, they’re also having to wait and see what happens to the entire climate. So, scientists need climate models, projected scenarios created by super computers, to help predict major climate changes.
Читать дальшеИнтервал:
Закладка:
Похожие книги на «Climate Change For Dummies»
Представляем Вашему вниманию похожие книги на «Climate Change For Dummies» списком для выбора. Мы отобрали схожую по названию и смыслу литературу в надежде предоставить читателям больше вариантов отыскать новые, интересные, ещё непрочитанные произведения.


Обсуждение, отзывы о книге «Climate Change For Dummies» и просто собственные мнения читателей. Оставьте ваши комментарии, напишите, что Вы думаете о произведении, его смысле или главных героях. Укажите что конкретно понравилось, а что нет, и почему Вы так считаете.