Paul J. Mitchell - Experimental Design and Statistical Analysis for Pharmacology and the Biomedical Sciences
Здесь есть возможность читать онлайн «Paul J. Mitchell - Experimental Design and Statistical Analysis for Pharmacology and the Biomedical Sciences» — ознакомительный отрывок электронной книги совершенно бесплатно, а после прочтения отрывка купить полную версию. В некоторых случаях можно слушать аудио, скачать через торрент в формате fb2 и присутствует краткое содержание. Жанр: unrecognised, на английском языке. Описание произведения, (предисловие) а так же отзывы посетителей доступны на портале библиотеки ЛибКат.

- Название:Experimental Design and Statistical Analysis for Pharmacology and the Biomedical Sciences
- Автор:
- Жанр:
- Год:неизвестен
- ISBN:нет данных
- Рейтинг книги:5 / 5. Голосов: 1
-
Избранное:Добавить в избранное
- Отзывы:
-
Ваша оценка:
Experimental Design and Statistical Analysis for Pharmacology and the Biomedical Sciences: краткое содержание, описание и аннотация
Предлагаем к чтению аннотацию, описание, краткое содержание или предисловие (зависит от того, что написал сам автор книги «Experimental Design and Statistical Analysis for Pharmacology and the Biomedical Sciences»). Если вы не нашли необходимую информацию о книге — напишите в комментариях, мы постараемся отыскать её.
Experimental Design and Statistical Analysis for Pharmacology and the Biomedical Sciences
in vitro
in vivo
priori
Experimental Design and Statistical Analysis for Pharmacology and the Biomedical Sciences
Experimental Design and Statistical Analysis for Pharmacology and the Biomedical Sciences — читать онлайн ознакомительный отрывок
Ниже представлен текст книги, разбитый по страницам. Система сохранения места последней прочитанной страницы, позволяет с удобством читать онлайн бесплатно книгу «Experimental Design and Statistical Analysis for Pharmacology and the Biomedical Sciences», без необходимости каждый раз заново искать на чём Вы остановились. Поставьте закладку, и сможете в любой момент перейти на страницу, на которой закончили чтение.
Интервал:
Закладка:
The step immediately prior to producing such a summary of experimental data is the Inferential Statistical tests employed to analyse the data. In the example provided here, this would be the two‐way ANOVA test followed by a suitable the post hoc test (here the Tukey test was used); why these tests were deemed appropriate will be explained later (see Chapter 17). The statistical test employed, however, is determined by the type and number of data sets produced by the experiment, but may include tests of data distribution and skewness, pairwise comparisons, other models of ANOVA, etc.
The step immediately prior to the Inferential Statistical analysis is the calculation of the Descriptive Statistics. These are the calculated summary values used to describe the data which are subsequently used to generate the data in the figure (e.g. bar height, etc.). Most experimental data are generally summarised by a measure of central tendency, such as the Mean (of which there are three types – but more about that later), together with the Standard Deviation or Standard Error of the Mean, Median (together with the range or semi‐quartile ranges), or Mode. However, note here that the measure of central tendency you report must be appropriate to the data your experiment has generated (see Chapters 5, 8, and 9).
The step prior to the statistical procedures is the input of your experimental data into your favourite statistical package. All statistical packages differ slightly from each other, but the most common method is to use a data spreadsheet similar to that seen with Microsoft Excel (see Figure 1.2). Figure 1.2 Excel spreadsheet showing original rodent locomotor activity data examining the effect of mesulergine on mCPP‐induced hypolocomotion (see Figure 1.1). The functionality of spreadsheets such as Microsoft Excel allows the calculation of simple Descriptive Statistics such as Mean, Standard Deviation, Standard Error of the Mean. Data on file.
Of course, you must generate your data before you are able to input such data into the spreadsheet and to achieve this you must decide on your experimental methodology – the process which generates a series of values which eventually allows you to draw conclusions about your experiment.
Before you decide on your methodology, however, you must have a working hypothesis which, in turn, is the result of your
experimental aims that address the
problem you have identified and is the raison d'etre of the whole experimental design process.
If we reverse these stages, then we have a list of events that summarise the experimental design process;
Experimental design process
1 What is the problem?
2 What is the aim?
3 Hypothesis
4 Experimental methodology
5 Data collection
6 Data input
7 Descriptive Statistical data
8 Inferential Statistical data
9 Final output
Notice that the Descriptive and Inferential Statistical steps (steps 7 and 8) are integral to the overall experimental design process. It is absolutely vital, therefore, that you decide on your statistical approach, both how you are going to convey (i.e. your summary figure or table) and analyse your data (Descriptive Statistics and Inferential Statistics, respectively) beforeyou perform your experiment! It is fundamentally unacceptable to complete your experiment, obtain your data, and then scratch your head wondering what statistical strategy you need to adopt to analyse your data; all this demonstrates is very poor experimental technique. (At this point refer back to Example 1 in the Foreword.)
Statistical analysis: why are statistical tests required? The eye‐ball test!
But why do we need statistics? Surely life would be so much easier, less complicated, and with reduced levels of anxiety if we just did not bother. However, as scientists we have a duty to communicate the results of our studies to the wider world, and so we need to have confidence in the data generated by our studies. Consequently, we must provide evidence that supports the conclusions derived from our studies, and that support is provided by the statistical analysis of our data – but we should not rely purely upon our statistical analysis. The statistical data generated by our analysis is there to supportour observations and not to replace what we can see with our own eyes. So, the first stage in analysing your data is to just look at it – but look at it with a critical eye. In Figure 1.1, it is quite clear that saline‐pre‐treated animals subsequently treated with m CPP exhibit far lower levels of locomotor activity than any of the other three treatment combinations – this simple observation is an example of the eye‐balltest (sometimes also known as the B.O. test – Bloody Obvious!). Importantly, the data also suggest that subjects pre‐treated with mesulergine subsequently fail to respond as expected to acute treatment with m CPP (i.e. they fail to show m CPP‐induced hypolocomotion); the main conclusion here, therefore, is that mesulergine blocks the behavioural effect of m CPP supporting the notion that because mesulergine is a 5‐HT 2Creceptor antagonist, then the hypolocomotor activity induced by m CPP is most likely mediated via agonist activity at 5‐HT 2Creceptors. The subsequent Inferential Statistical analysis simply supports this observation; this is important since the results of our statistical analysis should always be consistent with what we can see with our own eyes. If your statistical analysis contradicts what you can see, then there is something wrong in the presentation of your data, the statistical analysis used, or in the interpretation of the statistical results.
Another example of where the B.O. test alone provides confidence in our observations is the classical concentration–effect curve obtained with receptor agonists in isolated tissue experiments in vitro . Figure 1.3summarises the effect of increasing concentrations of the α 1adrenoceptor agonist, phenylephrine, on the rat anococcygeus muscle.
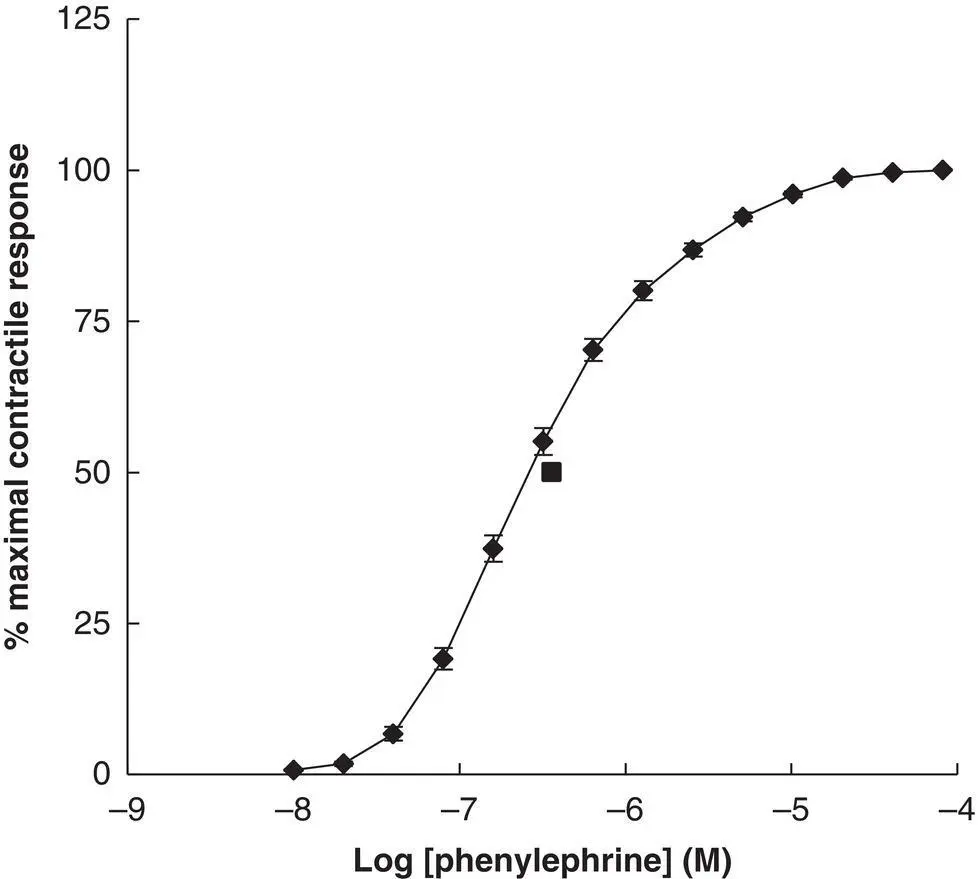
Figure 1.3 Phenylephrine‐induced contraction of the rat anococcygeus muscle.Values show Mean ± S.E.M ( N = 70) of the percentage maximal response (Y‐axis) plotted according to Log 10of the phenylephrine concentration (X‐axis). The mean EC 50value for phenylephrine (solid square) = 3.6 (2.8, 4.7) × 10 −7M. Mauchly's test indicated that the assumption of sphericity had been violated, χ 2(90) = 1903.64, p < 0.001. Subsequent Greenhouse–Geisser corrected (ε = 0.156) Repeated Measures ANOVA revealed significant variation between the responses according to dose [ F (2.027, 139.862) = 1618.36, p < 0.001]. Post hoc analysis (repeated Paired t ‐test with Bonferroni correction) revealed significant difference between successive concentrations ( p < 0.01) in all cases except between the highest two concentrations examined ( p > 0.05). Data on file.
Clearly phenylephrine induces contractions of this smooth muscle, the magnitude of which is obviously related to drug concentration until a maximal response is achieved. Do we really need high‐powered statistical analysis to tell us what our eyes can clearly see? Probably not, but for completeness, I have included a suitable analysis in the figure legend.
However, life, and the data we generate, is not always so clear‐cut. The problem occurs when we are presented with data that are somewhat equivocal such that the eye‐ball test starts to fail. In such cases we then rely heavily on the results of our statistical approach – that is perfectly acceptable, as long as we stick to a few basic rules that ensure we use the correct statistical approach to analyse and understand our data. If we fail to do so, then we severely run the risk of making erroneous, unsubstantiated conclusions. As scientists we need to have a robust, objective approach to data analysis, so we can arrive at our conclusions with confidence. It is important to acknowledge that nothing is ever proven with statistical analysis in the scientific world. Statistical analysis is all about probability,and the most we can hope for is to demonstrate the likelihood that two or more groups are either similar or different.
Читать дальшеИнтервал:
Закладка:
Похожие книги на «Experimental Design and Statistical Analysis for Pharmacology and the Biomedical Sciences»
Представляем Вашему вниманию похожие книги на «Experimental Design and Statistical Analysis for Pharmacology and the Biomedical Sciences» списком для выбора. Мы отобрали схожую по названию и смыслу литературу в надежде предоставить читателям больше вариантов отыскать новые, интересные, ещё непрочитанные произведения.


Обсуждение, отзывы о книге «Experimental Design and Statistical Analysis for Pharmacology and the Biomedical Sciences» и просто собственные мнения читателей. Оставьте ваши комментарии, напишите, что Вы думаете о произведении, его смысле или главных героях. Укажите что конкретно понравилось, а что нет, и почему Вы так считаете.