Paul J. Mitchell - Experimental Design and Statistical Analysis for Pharmacology and the Biomedical Sciences
Здесь есть возможность читать онлайн «Paul J. Mitchell - Experimental Design and Statistical Analysis for Pharmacology and the Biomedical Sciences» — ознакомительный отрывок электронной книги совершенно бесплатно, а после прочтения отрывка купить полную версию. В некоторых случаях можно слушать аудио, скачать через торрент в формате fb2 и присутствует краткое содержание. Жанр: unrecognised, на английском языке. Описание произведения, (предисловие) а так же отзывы посетителей доступны на портале библиотеки ЛибКат.

- Название:Experimental Design and Statistical Analysis for Pharmacology and the Biomedical Sciences
- Автор:
- Жанр:
- Год:неизвестен
- ISBN:нет данных
- Рейтинг книги:5 / 5. Голосов: 1
-
Избранное:Добавить в избранное
- Отзывы:
-
Ваша оценка:
Experimental Design and Statistical Analysis for Pharmacology and the Biomedical Sciences: краткое содержание, описание и аннотация
Предлагаем к чтению аннотацию, описание, краткое содержание или предисловие (зависит от того, что написал сам автор книги «Experimental Design and Statistical Analysis for Pharmacology and the Biomedical Sciences»). Если вы не нашли необходимую информацию о книге — напишите в комментариях, мы постараемся отыскать её.
Experimental Design and Statistical Analysis for Pharmacology and the Biomedical Sciences
in vitro
in vivo
priori
Experimental Design and Statistical Analysis for Pharmacology and the Biomedical Sciences
Experimental Design and Statistical Analysis for Pharmacology and the Biomedical Sciences — читать онлайн ознакомительный отрывок
Ниже представлен текст книги, разбитый по страницам. Система сохранения места последней прочитанной страницы, позволяет с удобством читать онлайн бесплатно книгу «Experimental Design and Statistical Analysis for Pharmacology and the Biomedical Sciences», без необходимости каждый раз заново искать на чём Вы остановились. Поставьте закладку, и сможете в любой момент перейти на страницу, на которой закончили чтение.
Интервал:
Закладка:
10 F distribution ( Figure 4.10)The F distribution (named after Sir Ronald Fisher, who developed the F distribution for use in determining the critical values for the Analysis of Variance (ANOVA) models; see Chapters 15, 16and 17) is a function of the ratio of two independent random variables (each of which has a Chi‐square distribution) divided by its respective number of Degrees of Freedom. It is used in several applications including assessing the equality of two or more population variances and the validity of equations following multiple regression analysis. The F‐distribution has two very important properties; first, it is defined for positive values only (this makes sense since all variance values are positive!), and second, unlike the t‐distribution, it is not symmetrical about its mean but instead is positively skewed.
So why do we need to understand data distribution?
Of the data distributions briefly described above, the majority are only of value to understand the theoretical basis of statistical analysis (the Chi square, t ‐ and F ‐distributions are important once we get into inferential statistics, but only if we wish to understand the process of how such tests work). In contrast, the most important distribution for the experimental pharmacologist is the Normal Distribution which shall be discussed in detail later (see Chapters 6and 7).
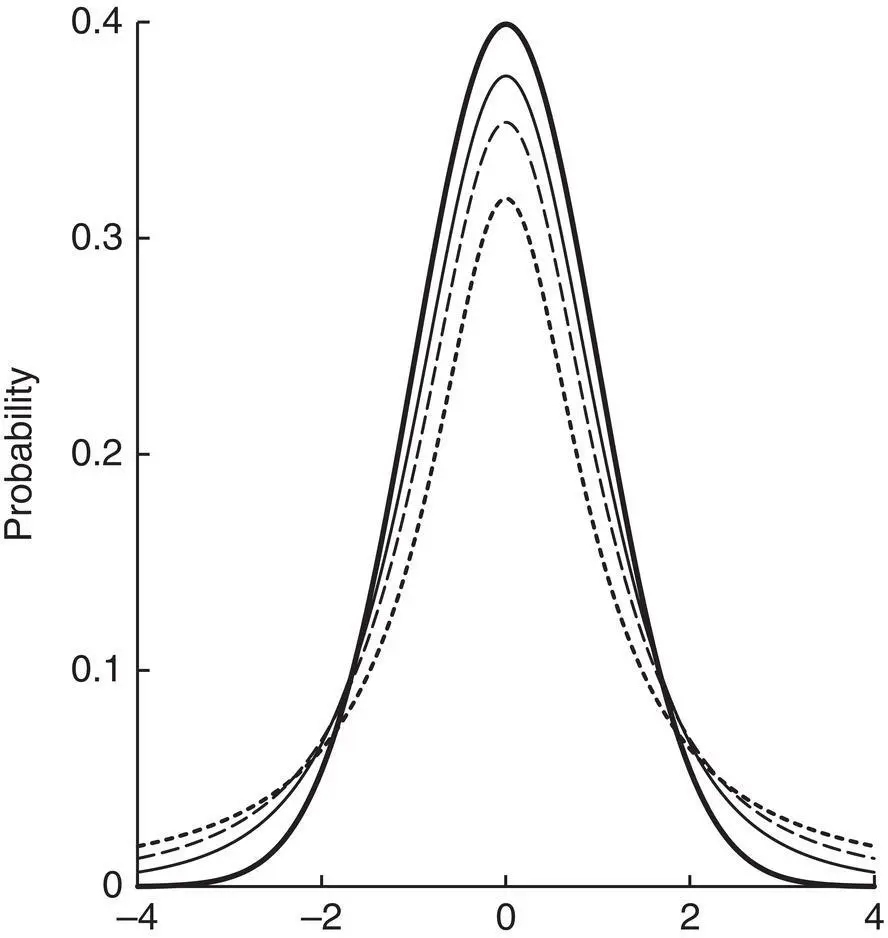
Figure 4.9 The t‐distribution.The probability density function of the t ‐distribution with 1 (dotted line), 2 (dashed line), and 4 (thin solid line) degrees of freedom compared with the Standard Normal Distribution (bold solid line; N(0,1)). For the t ‐distribution data the X‐axis values indicate the value of t . For the Standard Normal Distribution, the X values indicate the mean of zero with standard deviations either side of the mean. Y‐axis indicates probability in all cases. Note as the degrees of freedom increase so the probability density function of the t ‐distribution approximates towards the Standard Normal Distribution (see also Appendix A.5).
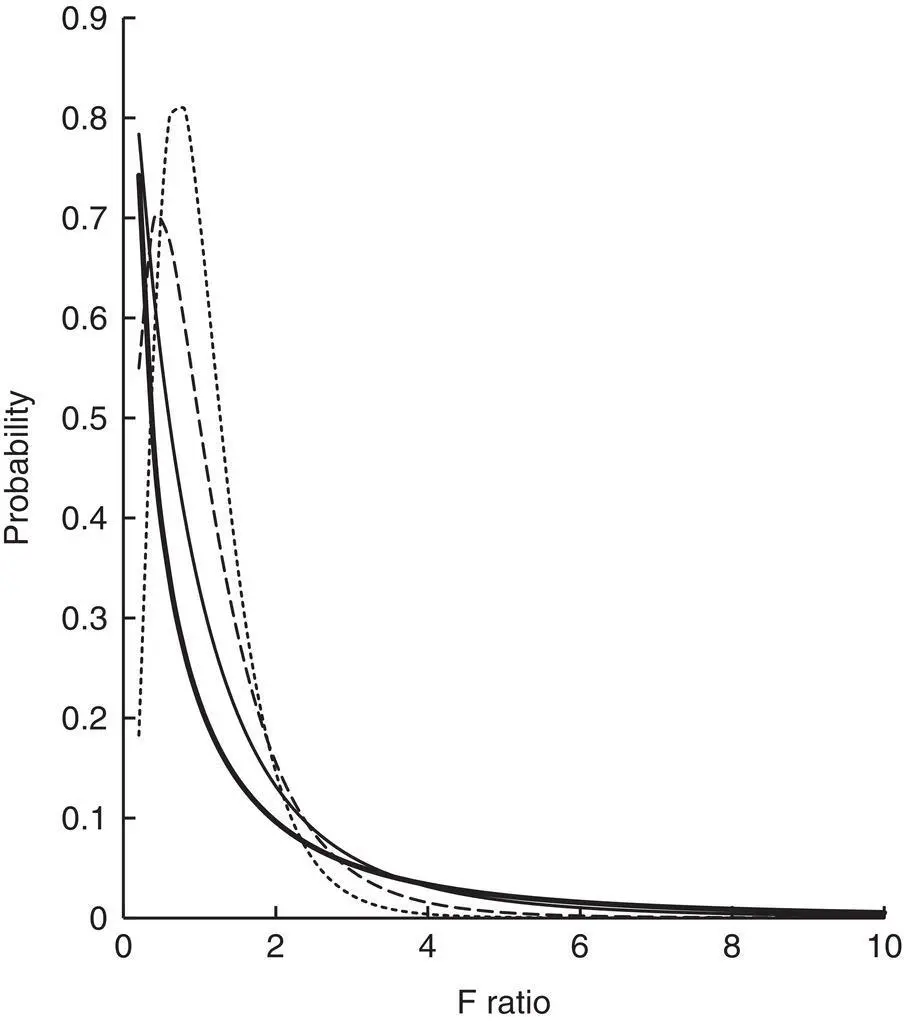
Figure 4.10 The F distribution.The probability density function of the F distribution with 1, 4 (bold solid line), 2, 8 (thin solid line), 4, 20 (dashed line), and 8, 32 (dotted line) degrees of freedom. X‐axis values indicate the F ratio, while Y‐axis values indicate probability density function (see also Appendix A.6)
Конец ознакомительного фрагмента.
Текст предоставлен ООО «ЛитРес».
Прочитайте эту книгу целиком, купив полную легальную версию на ЛитРес.
Безопасно оплатить книгу можно банковской картой Visa, MasterCard, Maestro, со счета мобильного телефона, с платежного терминала, в салоне МТС или Связной, через PayPal, WebMoney, Яндекс.Деньги, QIWI Кошелек, бонусными картами или другим удобным Вам способом.
Интервал:
Закладка:
Похожие книги на «Experimental Design and Statistical Analysis for Pharmacology and the Biomedical Sciences»
Представляем Вашему вниманию похожие книги на «Experimental Design and Statistical Analysis for Pharmacology and the Biomedical Sciences» списком для выбора. Мы отобрали схожую по названию и смыслу литературу в надежде предоставить читателям больше вариантов отыскать новые, интересные, ещё непрочитанные произведения.


Обсуждение, отзывы о книге «Experimental Design and Statistical Analysis for Pharmacology and the Biomedical Sciences» и просто собственные мнения читателей. Оставьте ваши комментарии, напишите, что Вы думаете о произведении, его смысле или главных героях. Укажите что конкретно понравилось, а что нет, и почему Вы так считаете.