Paul J. Mitchell - Experimental Design and Statistical Analysis for Pharmacology and the Biomedical Sciences
Здесь есть возможность читать онлайн «Paul J. Mitchell - Experimental Design and Statistical Analysis for Pharmacology and the Biomedical Sciences» — ознакомительный отрывок электронной книги совершенно бесплатно, а после прочтения отрывка купить полную версию. В некоторых случаях можно слушать аудио, скачать через торрент в формате fb2 и присутствует краткое содержание. Жанр: unrecognised, на английском языке. Описание произведения, (предисловие) а так же отзывы посетителей доступны на портале библиотеки ЛибКат.

- Название:Experimental Design and Statistical Analysis for Pharmacology and the Biomedical Sciences
- Автор:
- Жанр:
- Год:неизвестен
- ISBN:нет данных
- Рейтинг книги:5 / 5. Голосов: 1
-
Избранное:Добавить в избранное
- Отзывы:
-
Ваша оценка:
Experimental Design and Statistical Analysis for Pharmacology and the Biomedical Sciences: краткое содержание, описание и аннотация
Предлагаем к чтению аннотацию, описание, краткое содержание или предисловие (зависит от того, что написал сам автор книги «Experimental Design and Statistical Analysis for Pharmacology and the Biomedical Sciences»). Если вы не нашли необходимую информацию о книге — напишите в комментариях, мы постараемся отыскать её.
Experimental Design and Statistical Analysis for Pharmacology and the Biomedical Sciences
in vitro
in vivo
priori
Experimental Design and Statistical Analysis for Pharmacology and the Biomedical Sciences
Experimental Design and Statistical Analysis for Pharmacology and the Biomedical Sciences — читать онлайн ознакомительный отрывок
Ниже представлен текст книги, разбитый по страницам. Система сохранения места последней прочитанной страницы, позволяет с удобством читать онлайн бесплатно книгу «Experimental Design and Statistical Analysis for Pharmacology and the Biomedical Sciences», без необходимости каждый раз заново искать на чём Вы остановились. Поставьте закладку, и сможете в любой момент перейти на страницу, на которой закончили чтение.
Интервал:
Закладка:
The problem here is that we all get set in our ways and once we know that a particular technique works then we are loath to change it – even in the face of convincing arguments that our methodology could (should?) be improved or that our current methods are just plain wrong! The use of statistics in pharmacology has improved markedly over the last 15–20 years and bears little resemblance to the techniques used when I first started my career in pharmacology over 45 years ago. Even so, I still see example after example of manuscripts submitted to reputable scientific journals where the statistical analysis employed is wrong; indeed, the majority of manuscripts that I reject (I would estimate about 90%) are rejected on the basis of inappropriate (wrong) statistical analysis.
Experimental design and statistical analysis is not a burdensome and an inconvenient chore – stats is fun and very rewarding! In fact, statistics is only burdensome and an inconvenient chore to those who don't know what they're doing (or why) and are not prepared to learn or understand a few simple basic rules. I am an experimental pharmacologist with over 45 years' experience in designing a wide range of preclinical experiments in pharmacology (both in vitro and in vivo ) and through those years I have learnt the basic rules of statistical analysis and how such analyses should be coupled with the process of experimental design. Statistics, to me, is not an academic exercise but simply, in general terms, a tool by which I better understand the data generated by my experiments that enables me to make clear, concise and accurate conclusions about the change in data (usually induced by drug treatment – I am a pharmacologist after all) I observe. Statistics is a tool (not in the derogatory terminology), and just as a cabinet maker knows his tools to produce exquisite pieces of furniture (with each tool having a specific purpose), so the scientist needs to understand his statistical tools to analyse data and draw appropriate conclusions.
I have taught statistics for the better part of 25 years and during throughout this time I have always focused on three points.
1 There are different types of data. Identification of the type of data you have is important since this directly determines the type of statistical analysis which may be used on that data.
2 Once both the type of data and statistical test are identified, then it is just a simple matter of running the appropriate test on the data. These days with current computing power and the plethora of statistical analysis packages available, it is no longer necessary to perform statistical tests by hand and use lookup tables; it is simply a matter of ensuring the data is input into the stats package in the right format and then press the right button. This book will provide screen images of the output from some of the most common statistical packages commercially available (principally GraphPad Prism, Invivo Stat. MiniTab, and SPSS) so you'll know what to expect and look for when you use these packages to analyse your own experimental data.
3 Each statistical test you perform will produce an output. But how do you interpret that output? This book will explain how and help you to draw the appropriate conclusions from the statistical analysis of your own data.
So, you have a set of data and you know what type of data it is and what type of test you need to use to analyse that data. That directly leads to the correct conclusions – easy, isn't it! Well, perhaps not quite that easy, but this book will show you how. It will demystify statistical analysis so that, hopefully, if at some time in the future I said to you ‘Stats’, you wouldn't run into the distance under a tumultuous orange sky with your hands held to your face and your mouth in the shape of a polo mint, but instead you will smile benignly and, with a glint in your eye, say ‘Bring it on!’.
PJM 04/01/2021
1 Introduction
Experimental design: the important decision about statistical analysis
Whenever you make plans for your annual holiday, you do not just pack your suitcase willy‐nilly without first making plans about what you want to do, where you want to go, how you are going to get there, etc. For example, if your idea is to go trekking around the coast of Iceland, then you would look really stupid if, on arrival in Reykjavik, you opened your suitcase only to find beachwear and towels! Indeed, identifying what you want to do on holiday and where you intend to go determines what you need to take with you and what travel arrangements you need to make. In fact, what you do on holiday can be viewed as the final output of your holiday arrangements. The same can be said for the design of any well‐planned, robust, scientific experiment. The final output of your experiment, i.e. the communication of your results, whether it be a figure (scatter graph, bar chart, etc) or table, largely determines every single step in the preceding experimental design, including the strategy of your statistical analysis.
Figure 1.1shows the final output of an experiment which examined the effect of pre‐treatment with mesulergine (an antagonist at 5‐HT 2Creceptors) on the ability of m ‐chlorophenylpiperazine ( m CPP; a 5‐HT 2Creceptor agonist) to reduce the locomotor activity of rats.
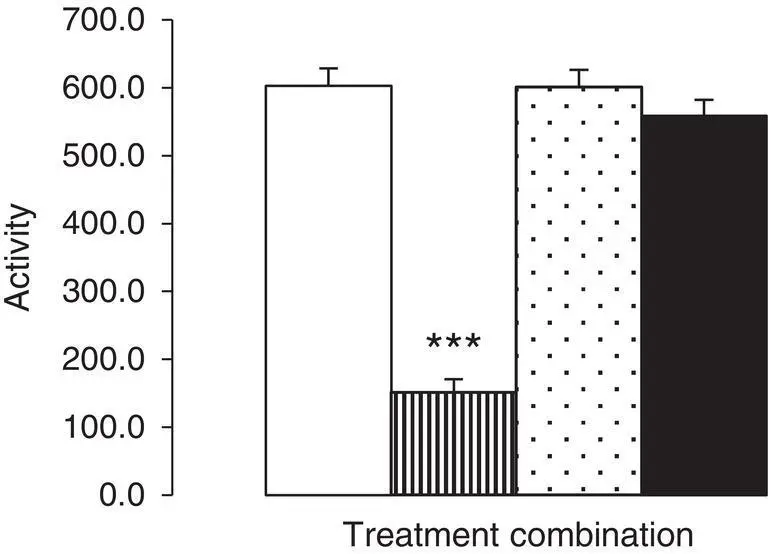
Figure 1.1 The effect of mesulergine on mCPP‐induced hypolocomotion.Vertical bars indicate mean locomotor activity counts ± Standard Error of the Mean. Saline‐pre‐treated animals were subcutaneously treated with either saline (open bar) or m CPP (vertical lines), while mesulergine‐pre‐treated subjects received either saline (stippled bar) or m CPP (solid bar). Two‐way ANOVA revealed main effects of pre‐treatment [ F (1,28) = 74.799] and challenge treatment [ F (1,28) = 110.999] and an interaction between pre‐ and challenge treatments [ F (1,28) = 76.095], p < 0.001 in all cases. Post hoc analysis (Tukey) revealed that saline + m CPP combination‐treated animals exhibited significantly lower levels of activity than the other three treatment combination groups (***, p < 0.001 in all cases). For all other pairwise comparisons, p > 0.05. Data on file.
The bar chart contains four bars, each corresponding to the treatment combination administered to the subject animals, which are aligned along the x‐axis and whose height equates to the calculated arithmetic meanvalue of the corresponding locomotor activity as indicated on the y‐axis. Below the figure is the legendwhich describes the contents of the bar chart. The legend is divided into three sections. The first part is the figure numberand the title,and usually these are in bold type. The second part is first half of the legend text in normal type and is a summary of the axis parametersarising from the experimental protocol,together with a summary of the Descriptive Statisticsused to produce the bars and the keyto differentiate each bar in the figure. The last part of the legend is a summary of the Inferential Statisticsand includes, in this example, the data arising from both the ANOVA modeland post hoc testsused to analyse the data (including an explanation of any indicators in the Figure, for example, the stars, used to identify significant differences between data sets); Screenshots of the statistical analysis are provided at the end of Chapter 17. This final output of your experiment is the last in a series of steps that comprise the complete experimental design process, and just as if you were planning your holiday to Iceland (the island, not the frozen food store!) or a sunny Mediterranean beach, it is easy to identify these steps in reverse order. Thus:
Читать дальшеИнтервал:
Закладка:
Похожие книги на «Experimental Design and Statistical Analysis for Pharmacology and the Biomedical Sciences»
Представляем Вашему вниманию похожие книги на «Experimental Design and Statistical Analysis for Pharmacology and the Biomedical Sciences» списком для выбора. Мы отобрали схожую по названию и смыслу литературу в надежде предоставить читателям больше вариантов отыскать новые, интересные, ещё непрочитанные произведения.


Обсуждение, отзывы о книге «Experimental Design and Statistical Analysis for Pharmacology and the Biomedical Sciences» и просто собственные мнения читателей. Оставьте ваши комментарии, напишите, что Вы думаете о произведении, его смысле или главных героях. Укажите что конкретно понравилось, а что нет, и почему Вы так считаете.