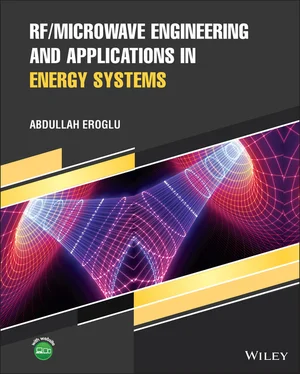
Abdullah Eroglu - RF/Microwave Engineering and Applications in Energy Systems
Здесь есть возможность читать онлайн «Abdullah Eroglu - RF/Microwave Engineering and Applications in Energy Systems» — ознакомительный отрывок электронной книги совершенно бесплатно, а после прочтения отрывка купить полную версию. В некоторых случаях можно слушать аудио, скачать через торрент в формате fb2 и присутствует краткое содержание. Жанр: unrecognised, на английском языке. Описание произведения, (предисловие) а так же отзывы посетителей доступны на портале библиотеки ЛибКат.
- Название:RF/Microwave Engineering and Applications in Energy Systems
- Автор:
- Жанр:
- Год:неизвестен
- ISBN:нет данных
- Рейтинг книги:5 / 5. Голосов: 1
-
Избранное:Добавить в избранное
- Отзывы:
-
Ваша оценка:
- 100
- 1
- 2
- 3
- 4
- 5
RF/Microwave Engineering and Applications in Energy Systems: краткое содержание, описание и аннотация
Предлагаем к чтению аннотацию, описание, краткое содержание или предисловие (зависит от того, что написал сам автор книги «RF/Microwave Engineering and Applications in Energy Systems»). Если вы не нашли необходимую информацию о книге — напишите в комментариях, мы постараемся отыскать её.
An essential text with a unique focus on RF and microwave engineering theory and its applications RF/Microwave Engineering and Applications in Energy Systems,
RF/Microwave Engineering and Applications in Energy Systems
RF/Microwave Engineering and Applications in Energy Systems — читать онлайн ознакомительный отрывок
Ниже представлен текст книги, разбитый по страницам. Система сохранения места последней прочитанной страницы, позволяет с удобством читать онлайн бесплатно книгу «RF/Microwave Engineering and Applications in Energy Systems», без необходимости каждый раз заново искать на чём Вы остановились. Поставьте закладку, и сможете в любой момент перейти на страницу, на которой закончили чтение.
Интервал:
Закладка:
 in a cylindrical coordinate system. Figure 1.7 Representation of vector
  in a spherical coordinate system. Figure 1.8 Representation of vector
  in a spherical coordinate system. Figure 1.9 Illustration of differential length, area, and volume in a Cartes... Figure 1.10 Illustration of differential length, area, and volume in a cylin... Figure 1.11 Illustration of differential length, area, and volume in a spher... Figure 1.12 Vector
  along the curve. Figure 1.13 Path for line integral Example 1.1. Figure 1.14 Illustration of surface integral. Figure 1.15 Illustration of gradient. Figure 1.16 Illustration of divergence theorem. Figure 1.17 Geometry of Example 1.4. Figure 1.18 Illustration of Stokes' theorem. Figure 1.19 Geometry of Example 1.5. Figure 1.20 Geometry for Problem 1.9. Figure 1.21 Geometry for Problem 1.10.
2 Chapter 2 Figure 2.1 Transfer characteristics: (a) passive component; (b) active compo... Figure 2.2 Conductor with uniform cross section. Figure 2.3 Representation of the resistor equivalent model: (a) ideal resist... Figure 2.4 Frequency characteristics of (a) ideal resistor and (b) nonideal ... Figure 2.5 Figure for Example 2.1. Figure 2.6 Resonance frequency plot for Example 2.1. Figure 2.7 (a) Two conductor capacitor. (b) HF model of capacitor. Figure 2.8 Equivalent parallel circuit. Figure 2.9 Plot of Z ( f ) versus frequency. Figure 2.10 Flux through each turn. Figure 2.11 HF effects of an RF inductor. Figure 2.12 HF model of an RF air core inductor. Figure 2.13 Equivalent series circuit. Figure 2.14 The HF characteristics of the inductor in Example 2.3. Figure 2.15 (a) Air core inductor. (b) Toroidal inductor. Figure 2.16 HF characteristics' response of air core inductor. Figure 2.17 Quality factor of air core inductor versus frequency. Figure 2.18 (a) Magnetic flux in toroidal magnetic core; (b) geometry of tor... Figure 2.19 (a) Rectangular spiral inductor. (b) Layout of current filaments... Figure 2.20 Toroidal transformer. Figure 2.21 Energy diagram of a semiconductor [5]. Figure 2.22 The performance comparison of WBG semiconductors for RF [9]. Figure 2.23 Family tree for power devices. Figure 2.24 Typical layer structure of (a) Si BJT and (b) InP/InGaAs HBT tra... Figure 2.25 Simplified structure of FET. Figure 2.26 FOM comparison of planar and trench MOSFET structures. Figure 2.27 Trench MOSFET: (a) Current Crowding in V‐Groove Trench MOSFET, (... Figure 2.28 Die size versus power loss. Figure 2.29 MOSFET structure capacitance illustration. Figure 2.30 Simplest view of MOSFET with intrinsic capacitances. Figure 2.31 HF small signal model for MOSFET transistor. Figure 2.32 HF small signal model for MOSFET transistor with extrinsic param... Figure 2.33 Simplified HF model for MOSFET. Figure 2.34 Incremental MOSFET HF small signal model. Figure 2.35 Conventional LDMOS structure. Figure 2.36 HEMT device structure: (a) open channel; (b) pinch off. Figure 2.37 Comparison of Si LDMOS and GaN HEMT. Figure 2.38 The market share for device technologies. Figure 2.39 Single bead geometry. Figure 2.40 Combined bead geometry. Figure 2.41 Equivalent circuit for the transformer. Figure 2.42 Isolation gate transformer. Figure 2.43 Step down transformer for load pull applications. Figure 2.44 VSWR = 1.5 : 1 autotransformer. Figure 2.45 Constructed 1.5 : 1 autotransformer. Figure 2.46 Measurement results of a 1.5 : 1 autotransformer. Figure 2.47 VSWR = 2 : 1 autotransformer. Figure 2.48 Measurement results of a 2 : 1 autotransformer. Figure 2.49 VSWR = 3 : 1 autotransformer. Figure 2.50 Measurement results of a 3 : 1 autotransformer. Figure 2.51 VSWR = 5 : 1 autotransformer. Figure 2.52 Measurement results of a 5 : 1 autotransformer. Figure 2.53 Problem 2.1. Figure 2.54 Problem 2.2. Figure 2.55 Transfer curve for MOSFET in Problem 2.4. Figure 2.56 Inductive switching circuit. Figure 2.57 IV curves with V GS= 0.1 steps. Figure 2.58 (a) Total gate measurement circuit. (b) Waveforms. Figure 2.59 Gate drive for MOSFET. Figure 2.60 Zero bias MOSFET model.Figure 2.61 Dimension of a toroidal core, T50 material.Figure 2.62 The geometry of a T106 core.Figure 2.63 Design Challenge 2.2.
3 Chapter 3Figure 3.1 Common transmission line structures: (a) coaxial line, (b) two‐wi...Figure 3.2 Short segment of transmission line.Figure 3.3 Finite terminated transmission line.Figure 3.4 Input impedance calculation on the transmission line.Figure 3.5 (a) The geometry of a coaxial cable and (b) commonly used commerc...Figure 3.6 The geometry of a two‐wire transmission line.Figure 3.7 Parallel plate transmission line.Figure 3.8 Lossless transmission line.Figure 3.9 Voltage versus transmission line length.Figure 3.10 Voltage versus transmission length for the example.Figure 3.11 Transmission line configuration for Example 3.5.Figure 3.12 Short circuited transmission line.Figure 3.13 Impedance variation for a short‐circuited transmission line.Figure 3.14 Low frequency equivalent circuit of short‐circuited transmission...Figure 3.15 Open‐circuited transmission line.Figure 3.16 Impedance variation for an open‐circuited transmission line.Figure 3.17 Low frequency equivalent circuit of an open‐circuited transmissi...Figure 3.18 Right‐hand portion of the normalized complex impedance plane.Figure 3.19 Conformal mapping of constant resistances.Figure 3.20 Conformal mapping of constant reactances.Figure 3.21 Combined conformal mapping lead to the display of a Smith chart....Figure 3.22 Smith chart displaying the calculated values and impedances.Figure 3.23 Input impedance display using a Smith chart.Figure 3.24 Admittance, Y , Smith chart.Figure 3.25 ZY Smith chart.Figure 3.26 Adding component using a ZY Smith chart.Figure 3.27 Impedance transformation.Figure 3.28 Impedance transformation using a Smith chart.Figure 3.29 Microstrip line: (a) field lines of microstrip line; (b) geometr...Figure 3.30 Representation of equivalent microstrip circuit.Figure 3.31 Three‐dimensional view of the microstrip line created in Ansoft ...Figure 3.32 Plot of Z 0vs frequency.Figure 3.33 S 11coefficient.Figure 3.34 Z 11parameter plot illustrating a 90° phase shift.Figure 3.35 Three‐dimensional view of the microstrip line created in Sonnet....Figure 3.36 Plot of Z 0.Figure 3.37 Plot of S11 coefficient.Figure 3.38 Z11 parameter plot illustrating a 90° phase shift.Figure 3.39 Stripline configuration.Figure 3.40 Field distribution for stripline configuration.Figure 3.41 Typical microstrip directional coupler configuration.Figure 3.42 MATLAB GUI for the calculation of the physical parameters of a c...Figure 3.43 Simulation results of a microstrip coupler at 300 MHz.Figure 3.44 Twisted wire configuration.Figure 3.45 Problem 3.4.Figure 3.46 Problem 3.7.Figure 3.47 Problem 3.8.Figure 3.48 Problem 3.9.Figure 3.49 Problem 3.11.Figure 3.50 Problem 3.12.
4 Chapter 4Figure 4.1 Two‐port network representation.Figure 4.2 Circuit for Example 4.1.Figure 4.3 Application of nodal voltage method for Z 11and Z 21.Figure 4.4 Application of nodal voltage method for Z 11and Z 22Figure 4.5 ABCD parameter of cascaded networks.Figure 4.6 Coupling transformer example.Figure 4.7 Conversion of transformer coupling circuit to equivalent circuit....Figure 4.8 Transformer coupling circuit equivalent circuit.Figure 4.9 T network configuration.Figure 4.10 Series connection of two‐port networks.Figure 4.11 Parallel connection of two‐port networks.Figure 4.12 Cascade connection of two‐port networks.Figure 4.13 RF amplifier analysis by network parameters.Figure 4.14 Partition of amplifier circuit for network analysis.Figure 4.15 Illustration of parallel connection between Networks 2 and 3.Figure 4.16 Cascade connection of final circuit.Figure 4.17 Current gain of RF amplifier versus feedback resistor values and...Figure 4.18 Voltage gain of RF amplifier versus feedback resistor values and...Figure 4.19 (a) N network for analysis; (b) network transformation to T netw...Figure 4.20 Small signal MOSFET model.Figure 4.21 The simplified equivalent circuit for the MOSFET small signal mo...Figure 4.22 The network equivalent circuit for the MOSFET small signal model...Figure 4.23 The equivalent circuit for Network 3.Figure 4.24 The equivalent circuit for Network 4.Figure 4.25 Voltage gain and phase responses.Figure 4.26 One‐port network for scattering parameter analysis.Figure 4.27 N ‐port network for scattering analysis.Figure 4.28 Two‐port transistor network.Figure 4.29 S parameters for two‐port networks.Figure 4.30 T network configuration.Figure 4.31 Transformer circuit.Figure 4.32 Transformer coupling circuit for S 11and S 21.Figure 4.33 Transformer coupling circuit for S 22and S 12.Figure 4.34 Illustration of chain scattering matrix for cascaded networks.Figure 4.35 Implementation of SOLT calibration for network analyzer.Figure 4.36 GCPW for SOLT calibration fixture implementation.Figure 4.37 “Thru” calibration test fixture – top view.Figure 4.38 “Open” calibration test fixture.Figure 4.39 “Load” calibration test fixture.Figure 4.40 “Short” calibration test fixture.Figure 4.41 BFR92 bias simulation test setup.Figure 4.42 Biasing test fixture for BRF92.Figure 4.43 Network analyzer measurement setup of BRF 92.Figure 4.44 Quarter‐wave coplanar waveguide transmission line used for simul...Figure 4.45 Quarter‐wave short circuit simulation.Figure 4.46 Quarter‐wave open circuit simulation.Figure 4.47 S parameters of coplanar waveguide transmission line without stu...Figure 4.48 Quarter‐wave stub attached to input port.Figure 4.49 Quarter‐wave short circuit stub attached at input port.Figure 4.50 Quarter‐wave stub with capacitor attached at input port.Figure 4.51 Quarter‐wave stub attached to both input and output ports.Figure 4.52 Quarter‐wave short circuit stub attached to both input and outpu...Figure 4.53 Quarter‐wave stub with capacitor attached at both input and outp...Figure 4.54 Input return loss comparison ( S 11); V CE= 10 V, I C= 5 mA.Figure 4.55 Output return loss comparison ( S 22); V CE= 10 V, I C= 5 mA.Figure 4.56 Reverse isolation comparison ( S 12); V CE= 10 V, I C= 5 mA.Figure 4.57 Forward gain comparison ( S 21); V CE= 10 V, I C= 5 mA.Figure 4.58 Zero biased small signal two‐port network at low frequencies.Figure 4.59 Problem 4.1.Figure 4.60 Problem 4.2.Figure 4.61 Problem 4.3.Figure 4.62 Problem 4.4.Figure 4.63 Problem 4.5.Figure 4.64 Problem 4.6.Figure 4.65 Problem 4.7.Figure 4.66 Problem 4.9.Figure 4.67 Problem 4.10.Figure 4.68 TO‐247 MOSFET package measurement setup.
Читать дальшеИнтервал:
Закладка:
Похожие книги на «RF/Microwave Engineering and Applications in Energy Systems»
Представляем Вашему вниманию похожие книги на «RF/Microwave Engineering and Applications in Energy Systems» списком для выбора. Мы отобрали схожую по названию и смыслу литературу в надежде предоставить читателям больше вариантов отыскать новые, интересные, ещё непрочитанные произведения.
Обсуждение, отзывы о книге «RF/Microwave Engineering and Applications in Energy Systems» и просто собственные мнения читателей. Оставьте ваши комментарии, напишите, что Вы думаете о произведении, его смысле или главных героях. Укажите что конкретно понравилось, а что нет, и почему Вы так считаете.
