Isotopic Constraints on Earth System Processes
Здесь есть возможность читать онлайн «Isotopic Constraints on Earth System Processes» — ознакомительный отрывок электронной книги совершенно бесплатно, а после прочтения отрывка купить полную версию. В некоторых случаях можно слушать аудио, скачать через торрент в формате fb2 и присутствует краткое содержание. Жанр: unrecognised, на английском языке. Описание произведения, (предисловие) а так же отзывы посетителей доступны на портале библиотеки ЛибКат.
- Название:Isotopic Constraints on Earth System Processes
- Автор:
- Жанр:
- Год:неизвестен
- ISBN:нет данных
- Рейтинг книги:4 / 5. Голосов: 1
-
Избранное:Добавить в избранное
- Отзывы:
-
Ваша оценка:
Isotopic Constraints on Earth System Processes: краткое содержание, описание и аннотация
Предлагаем к чтению аннотацию, описание, краткое содержание или предисловие (зависит от того, что написал сам автор книги «Isotopic Constraints on Earth System Processes»). Если вы не нашли необходимую информацию о книге — напишите в комментариях, мы постараемся отыскать её.
Volume highlights include: Isotopic Constraints on Earth System Processes
The American Geophysical Union promotes discovery in Earth and space science for the benefit of humanity. Its publications disseminate scientific knowledge and provide resources for researchers, students, and professionals.
Isotopic Constraints on Earth System Processes — читать онлайн ознакомительный отрывок
Ниже представлен текст книги, разбитый по страницам. Система сохранения места последней прочитанной страницы, позволяет с удобством читать онлайн бесплатно книгу «Isotopic Constraints on Earth System Processes», без необходимости каждый раз заново искать на чём Вы остановились. Поставьте закладку, и сможете в любой момент перейти на страницу, на которой закончили чтение.
Интервал:
Закладка:
The behavior of the model is shown in Fig. 2.6for an infinite diffusion couple where the initial concentration gradient is small and  = 8. If C fis negative ( Fig. 2.6a), the element partitions into the high‐silica liquid and the hypothetical C egradient opposes the concentration gradient. In this case, mass diffuses from the high concentration to the low concentration side at a higher rate than if C f=0, resulting in a pair of bumps in the concentration profile. If C fis positive ( Fig. 2.6b), the activity gradient is opposite the concentration gradient and uphill diffusion occurs. Note that in both cases, the C eprofile evolves at a rate given by D b( equation 2.6) and is thus less evolved than the concentration profiles exhibiting uphill diffusion.
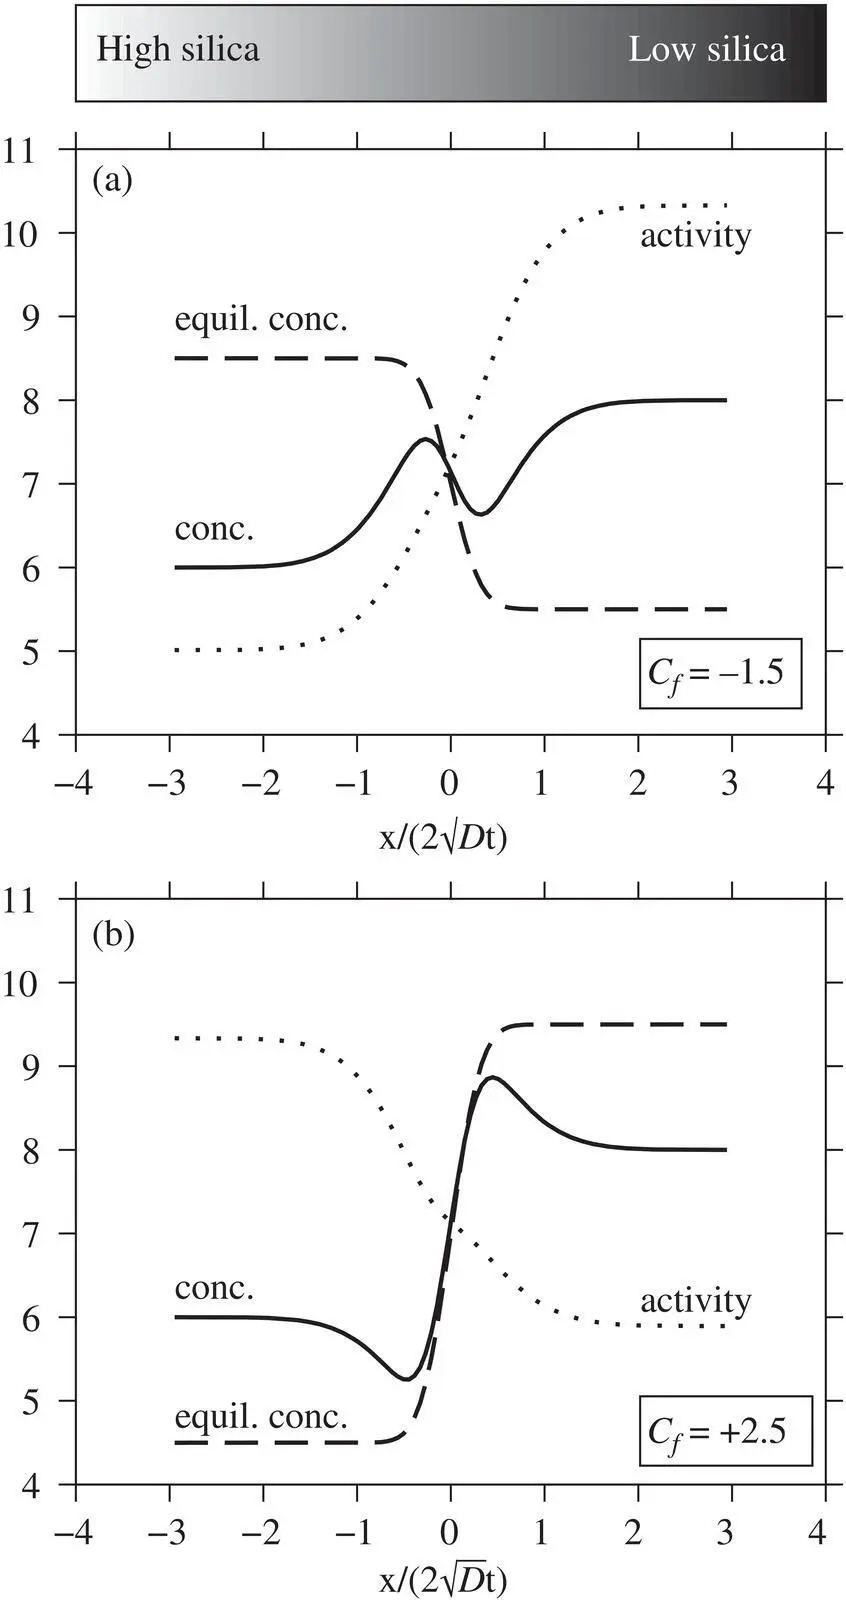
Figure 2.6 Model behavior showing concentration, activity, and transient equilibrium concentration profiles for C −= 6 wt%, C += 8 wt%,  /D b= 8, and variable C f. The top panel is identical to Fig. 2c in Zhang (1993) to validate the Matlab code used in calculations herein. For an element with small initial concentration contrast, the sign and magnitude of uphill diffusion depends on the sign and magnitude of C f, which describes how the element partitions between high silica versus low silica liquids.
Model Applied to the Rhyolite‐Phonolite Couples
The rhyolite‐phonolite diffusion couple spans a broad range of melt compositions. Although the diffusion coefficients are expected to be sensitive to melt composition across this range, we assume  and D bare constant. We also treat the diffusion couple as infinite with respect to SiO 2even though we see some uphill diffusion of SiO 2at the ends of the couple in the 2.5 hour run. This, however, may just be due to mass balance and dilution effects caused by the faster diffusing components. For the faster diffusing K 2O and CaO components, the diffusion couple is not treated as infinite; i.e., ∂ C/ ∂x = 0 at the boundaries.
Despite the many simplifying assumptions that are needed to distill a general multicomponent diffusion problem down to a three‐parameter model ( C f, D b, and  ), the modified EBD model is capable of reproducing the sign and magnitude of uphill diffusion in the K 2O and CaO profiles ( Fig. 2.7a–f). The positive C ffor CaO implies that CaO partitions into mafic liquids whereas the negative C ffor K 2O implies that K 2O partitions into felsic liquids, which is consistent with the known partitioning behavior of these two oxide components (Ryerson & Hess, 1978; Watson, 1976). The misfit on the ends of the CaO profiles suggest that the activity of CaO depends on melt components in addition to SiO 2. The next level of complexity would be to include the alkali components in the activity‐composition model for CaO.
The goodness‐of‐fit for the K 2O profile is even less satisfying due to the unusual shape of the measured K 2O profile, which is nearly flat on the mafic side and linear to nearly convex on the felsic side. This shape cannot be reproduced using the simplified EBD models discussed herein. Nevertheless, the inferred  is a reasonable average value, being somewhat overestimated on the rhyolite side and somewhat underestimated on the phonolite side. A better fit could be obtained by casting
  as a function of SiO 2concentration (Richter et al., 2003, 2009; Watkins et al., 2009) or by introducing some other additional ad hoc complexity into the model. We did not undertake such efforts because the calculated concentration profiles provide an adequate description of the K 2O fluxes to be used as a baseline for modeling the isotope ratio profiles.
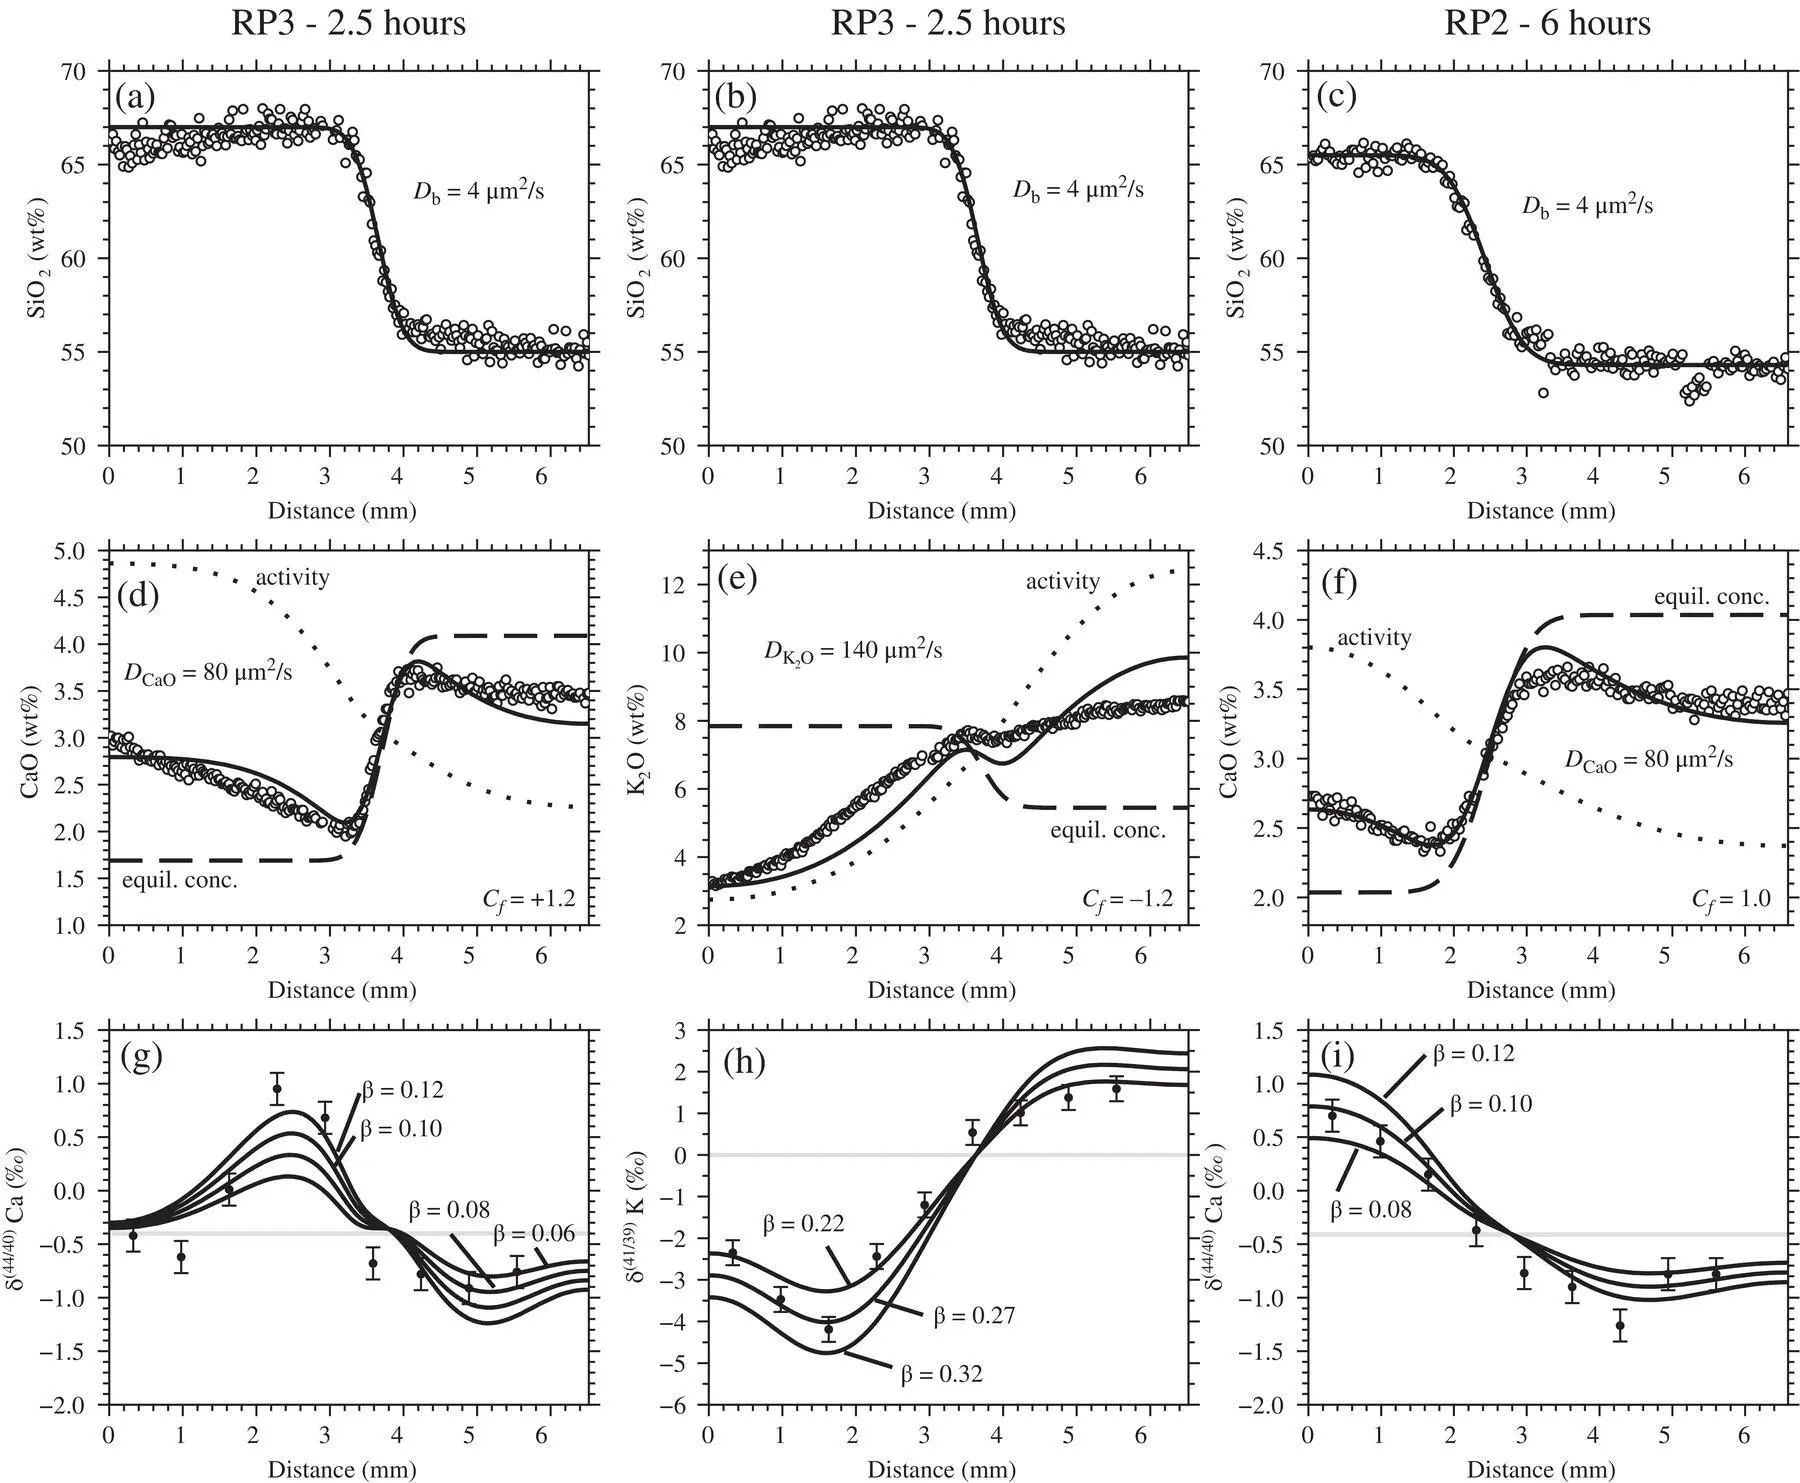
Figure 2.7 The modified EBD model applied to the data. Top panels: SiO 2diffusion is well‐approximated as effective binary in an infinite medium. Middle panels: Both CaO and K 2O exhibit uphill diffusion, which is attributed in the model to transient partitioning between high‐silica and low‐silica liquids. Bottom panels: Despite the simplifying assumptions, the model captures the sign and magnitude of diffusive isotope effects.
Model for the Isotope Ratio Profiles
Model isotope ratio profiles are generated by invoking a difference in diffusivity between the isotopes of an element. The dependence of diffusivity on mass can be written as (Richter et al., 1999):
(2.9) 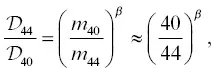
where β is a dimensionless empirical parameter. Here, m refers to the isotopic mass and not the mass of an isotopically substituted molecule such as, for example, CaAl 2O 4. This functional form is based on principles from the kinetic theory of gases, but it’s also convenient because it normalizes out the fractional mass difference between isotopes, thereby allowing for direct comparison between different isotopic systems.
To model the isotope ratio profiles, we assume the rhyolite and phonolite have the same isotopic composition since they are within error of each other with respect to δ 44Ca. Although we did not directly measure the δ 41K of either starting material, the assumption that they are the same can be justified on the basis that the global range in δ 41K of igneous rocks and minerals is < 1‰ (Morgan et al., 2018). We assume further that the equilibrium isotope ratio profile is uniform at all times; i.e., C e, 44is defined to be proportional to C e, 40such that the ratio C e, 44/ C e, 40is constant, which implies that there is no equilibrium isotopic partitioning between the liquids. Hence, any isotopic fractionations in the model arise solely from diffusive fluxes and the difference in isotopic diffusion coefficients.
Model isotopic profiles are compared to the data in the bottom panels of Fig. 2.7. For Ca isotopes, no single set of parameters (  , D b, C f, and β ) can explain the full profile or its time evolution reflected in the 2.5‐ and 6‐hour runs. Nevertheless, the fits are qualitatively no worse than those used to estimate β factors and associated uncertainties in other natural silicate liquid diffusion couple experiments (Richter et al., 2003; Watkins et al., 2009). By plotting model curves corresponding to different values of β against the data, we estimate β = 0.10 ± 0.02. This is a somewhat crude estimate, however, and appears to be on the low side for the rhyolite while fitting the phonolite in the 2.5‐hour run, and on the low side for the phonolite while fitting the rhyolite in the 6‐hour run. For K isotopes, we estimate β = 0.25 ± 0.03, which is comparable to the value for Li ( β = 0.21–0.23) in basalt‐rhyolite and rhyolite‐rhyolite diffusion couples (Holycross et al., 2018; Richter et al., 2003).
Интервал:
Закладка:
Похожие книги на «Isotopic Constraints on Earth System Processes»
Представляем Вашему вниманию похожие книги на «Isotopic Constraints on Earth System Processes» списком для выбора. Мы отобрали схожую по названию и смыслу литературу в надежде предоставить читателям больше вариантов отыскать новые, интересные, ещё непрочитанные произведения.


Обсуждение, отзывы о книге «Isotopic Constraints on Earth System Processes» и просто собственные мнения читателей. Оставьте ваши комментарии, напишите, что Вы думаете о произведении, его смысле или главных героях. Укажите что конкретно понравилось, а что нет, и почему Вы так считаете.