Isotopic Constraints on Earth System Processes
Здесь есть возможность читать онлайн «Isotopic Constraints on Earth System Processes» — ознакомительный отрывок электронной книги совершенно бесплатно, а после прочтения отрывка купить полную версию. В некоторых случаях можно слушать аудио, скачать через торрент в формате fb2 и присутствует краткое содержание. Жанр: unrecognised, на английском языке. Описание произведения, (предисловие) а так же отзывы посетителей доступны на портале библиотеки ЛибКат.
- Название:Isotopic Constraints on Earth System Processes
- Автор:
- Жанр:
- Год:неизвестен
- ISBN:нет данных
- Рейтинг книги:4 / 5. Голосов: 1
-
Избранное:Добавить в избранное
- Отзывы:
-
Ваша оценка:
Isotopic Constraints on Earth System Processes: краткое содержание, описание и аннотация
Предлагаем к чтению аннотацию, описание, краткое содержание или предисловие (зависит от того, что написал сам автор книги «Isotopic Constraints on Earth System Processes»). Если вы не нашли необходимую информацию о книге — напишите в комментариях, мы постараемся отыскать её.
Volume highlights include: Isotopic Constraints on Earth System Processes
The American Geophysical Union promotes discovery in Earth and space science for the benefit of humanity. Its publications disseminate scientific knowledge and provide resources for researchers, students, and professionals.
Isotopic Constraints on Earth System Processes — читать онлайн ознакомительный отрывок
Ниже представлен текст книги, разбитый по страницам. Система сохранения места последней прочитанной страницы, позволяет с удобством читать онлайн бесплатно книгу «Isotopic Constraints on Earth System Processes», без необходимости каждый раз заново искать на чём Вы остановились. Поставьте закладку, и сможете в любой момент перейти на страницу, на которой закончили чтение.
Интервал:
Закладка:
where ( 41K/ 39K) referenceis the average of the two bracketing analyses of the K reference solution prior to and after the analysis of the sample. The sample solutions were introduced to the IsoProbe using using an Aridus II (Cetac Technologies) desolvation system with a Teflon nebulizer with a measured uptake of 60 microlitres/minute. Approximately 150 ng of K was used per isotopic analysis run. The typical uncertainty in δ 41K is conservatively given as ± 0.3‰ and is based on the combined uncertainties in the measured 41K/ 39K of the bracketing reference and samples. Further details on the mass spectrometry technique can be found in Richter et al. (2011).
2.3. RESULTS
2.3.1. Major Element Diffusion Profiles
Major‐element diffusion profiles from two experiments that differ in duration (2.5 versus 6 hours) are shown in Fig. 2.3. Note that the x‐coordinates of both profiles have been shifted such that the phonolite‐rhyolite interfaces overlap and the profiles are framed within each panel. Additionally, in the 6‐hour experiment the capsule was loaded with more phonolite powder (0.07 g) than rhyolite powder (0.04 g), and consequently, the rhyolite side of the couple is short, occupying only about one‐third of the capsule length.
The major element profiles exhibit features that are interesting, although we cannot fully explain some of them. We observe uphill diffusion (i.e., diffusion of a component against its own concentration gradient) in all the major‐element oxides, including SiO 2. The SiO 2and Al 2O 3profiles change relatively little from the starting materials, which is expected because of the low diffusivities of these components and the coupling between Si and Al in the silicate framework components of the liquids. One thing that is unexpected is that the absolute concentrations of SiO 2and Al 2O 3on the rhyolite end of the profiles are low relative to the starting values. This should be regarded as an analytical inconsistency as it cannot be explained by a dilution effect. The absolute concentrations of Na 2O are even more problematic, being too high relative to the starting materials. The simplest explanation is that the starting materials actually had Na 2O concentrations that were about 0.5% higher than reported. This is unexpected, but possible, since it is well known that Na can be volatilized during EMP analysis, leading to incorrectly low measured concentrations. These issues do not significantly affect the main conclusions that we draw from the Ca and K isotopic results.
A notable feature of the data is the dramatic rearrangement of the Na, Ca, and K components in the 2.5 hour run. The K profile is strongly affected by rapid diffusion of K from the phonolite to the rhyolite, producing a steep K concentration profile in the rhyolite. The large increase in K in the rhyolite, especially close to the contact with phonolite, is accommodated mostly by rapid diffusion of Ca and some Na from the rhyolite to the phonolite. Apparently, as the Ca gradient becomes steep within the rhyolite, Na diffuses both into the phonolite, and toward the rhyolite end of the capsule to maintain a near‐constant Na/Ca within the rhyolite. We have not attempted to capture this coupling in our modeling of Ca (see Section 2.5), but since Na diffuses rapidly, its movement probably does not greatly affect the diffusion of Ca. The Na/Ca ratio (or Ca/(Ca+Na) ratio) is nearly constant within the rhyolite, and within the phonolite, which is a clear indication that both Na and Ca diffuse quickly to what must be thermodynamically favored Na/Ca ratios that are presumably determined largely by the SiO 2(± Al 2O 3) of the two liquids.
2.3.2. Ca and K Isotopes
The phonolite‐rhyolite diffusion couples produced large diffusive isotope effects in both Ca ( Fig. 2.4a) and K ( Fig. 2.4b). For Ca isotopes, the felsic side is enriched in the heavy isotope whereas the mafic side is enriched in the light isotope, consistent with a net flux of CaO from the felsic to the mafic liquid despite a negligible initial compositional contrast. In the 2.5‐hour run, the δ 44Ca is equal to the initial value (within error) on the felsic side. It is unclear if the δ 44Ca has changed from the initial value on the mafic side because the endmost wafer was not successfully extracted during sample preparation. The total range in δ 44Ca is about 2 in the 2.5‐hour run. In the 6‐hour run, the shape of the profile is similar but more time‐evolved. The Ca isotopic composition has changed significantly from the initial value at both ends of the capsule with a total range in δ 44Ca of about 1.5‰.
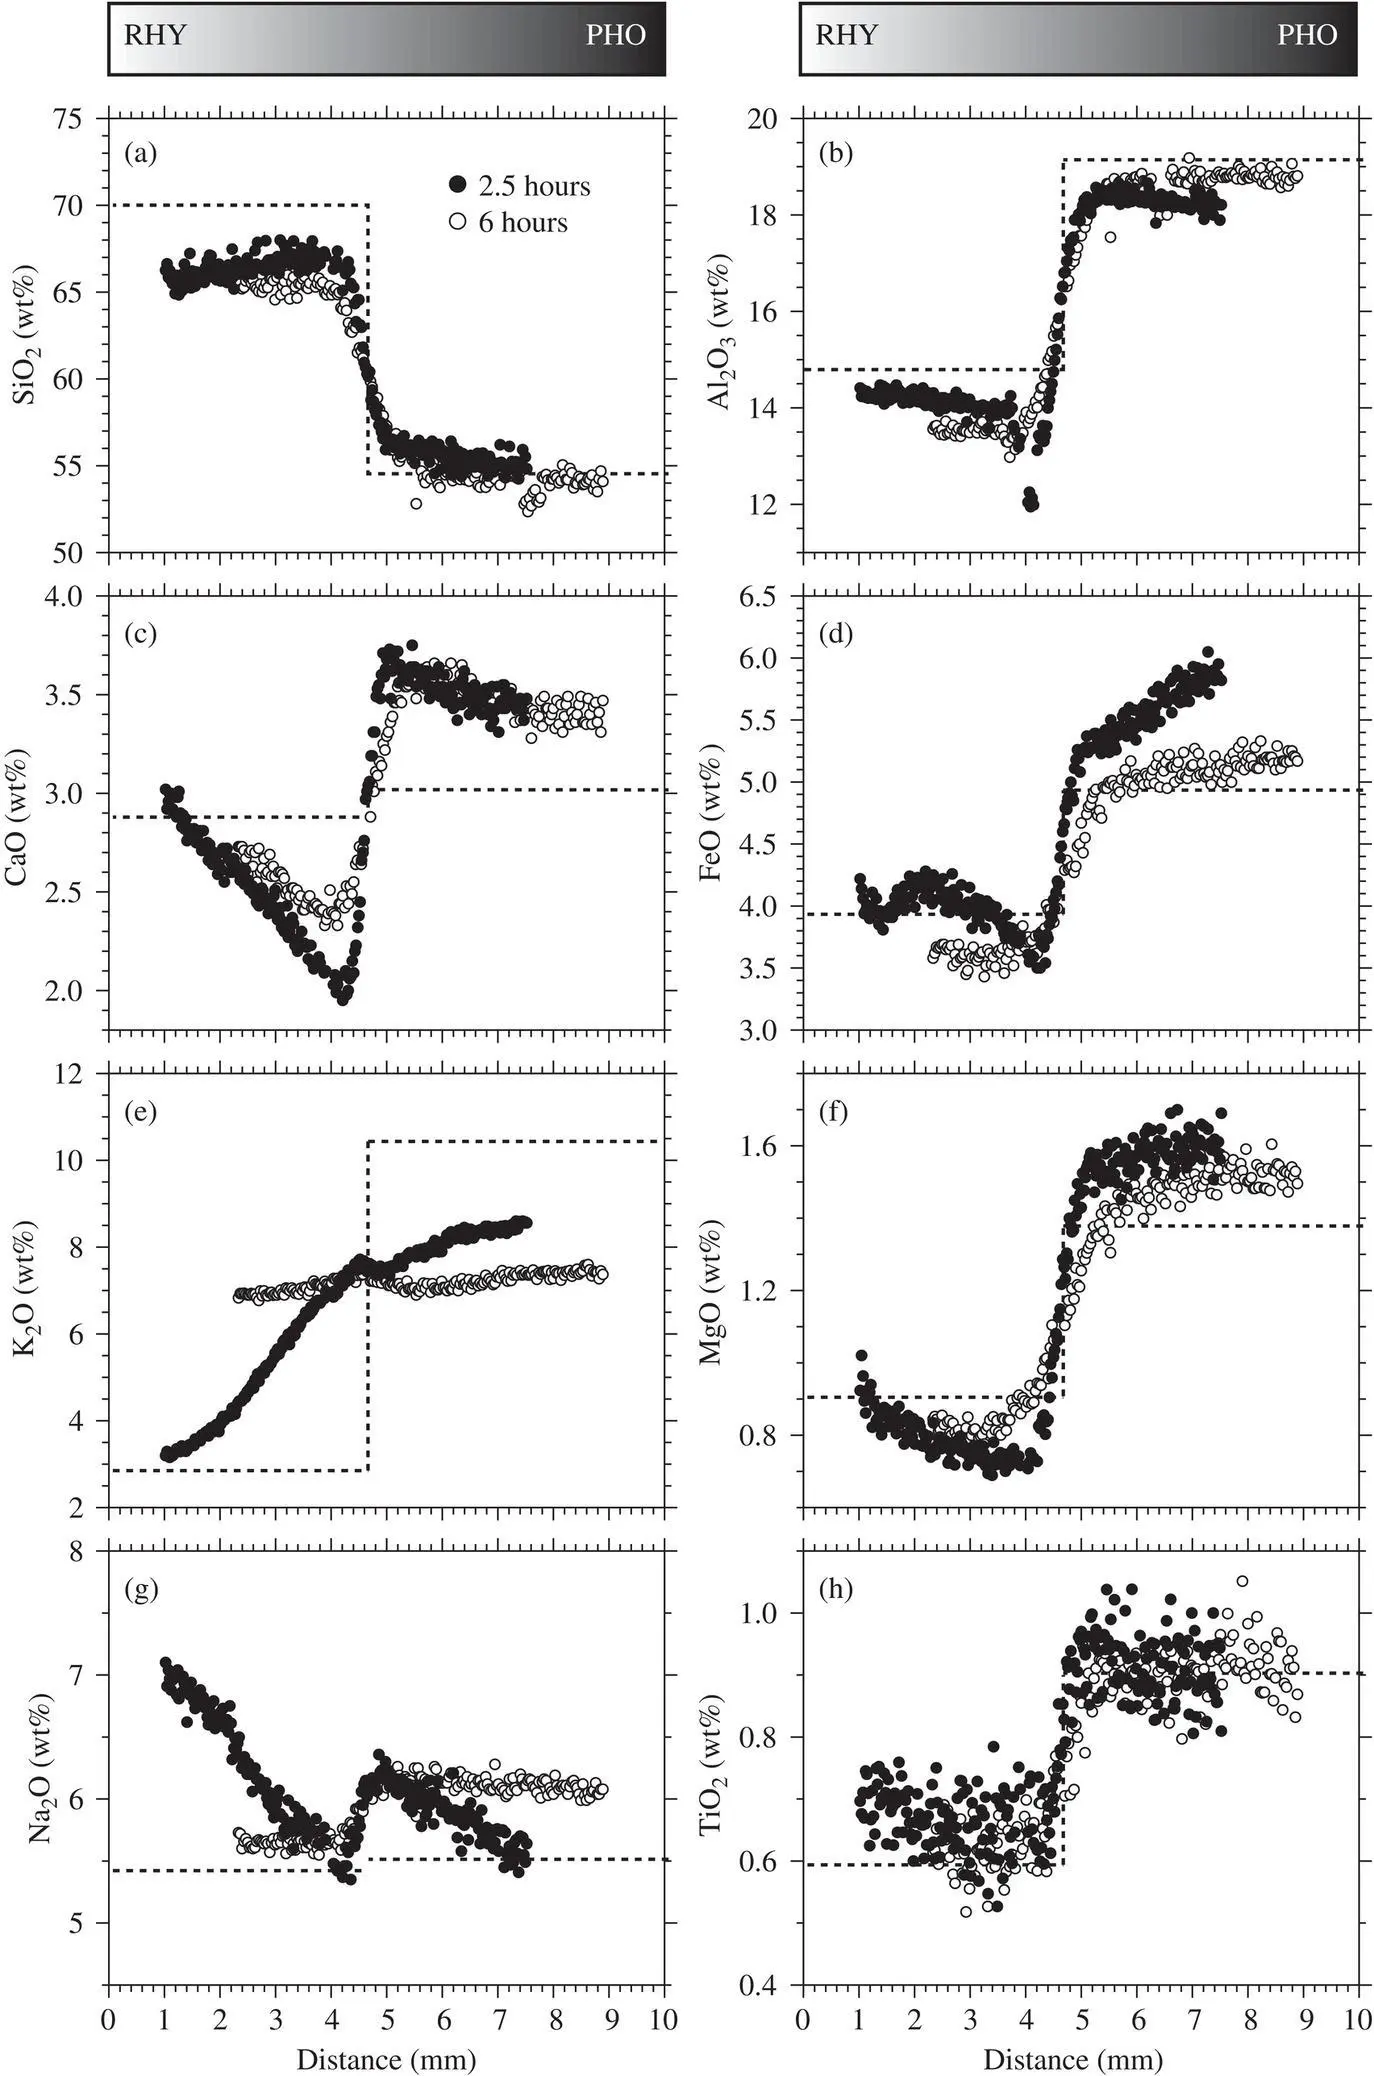
Figure 2.3 Major‐element diffusion profiles from two experiments lasting 2.5 hours and 6 hours. Note that the data have been shifted to the right by 1 mm and 2.3 mm for the 2.5 hour and 6 hour runs, respectively, in order to align the interfaces and frame the profiles within each panel. The dashed line shows the initial composition based on Table 2.1.
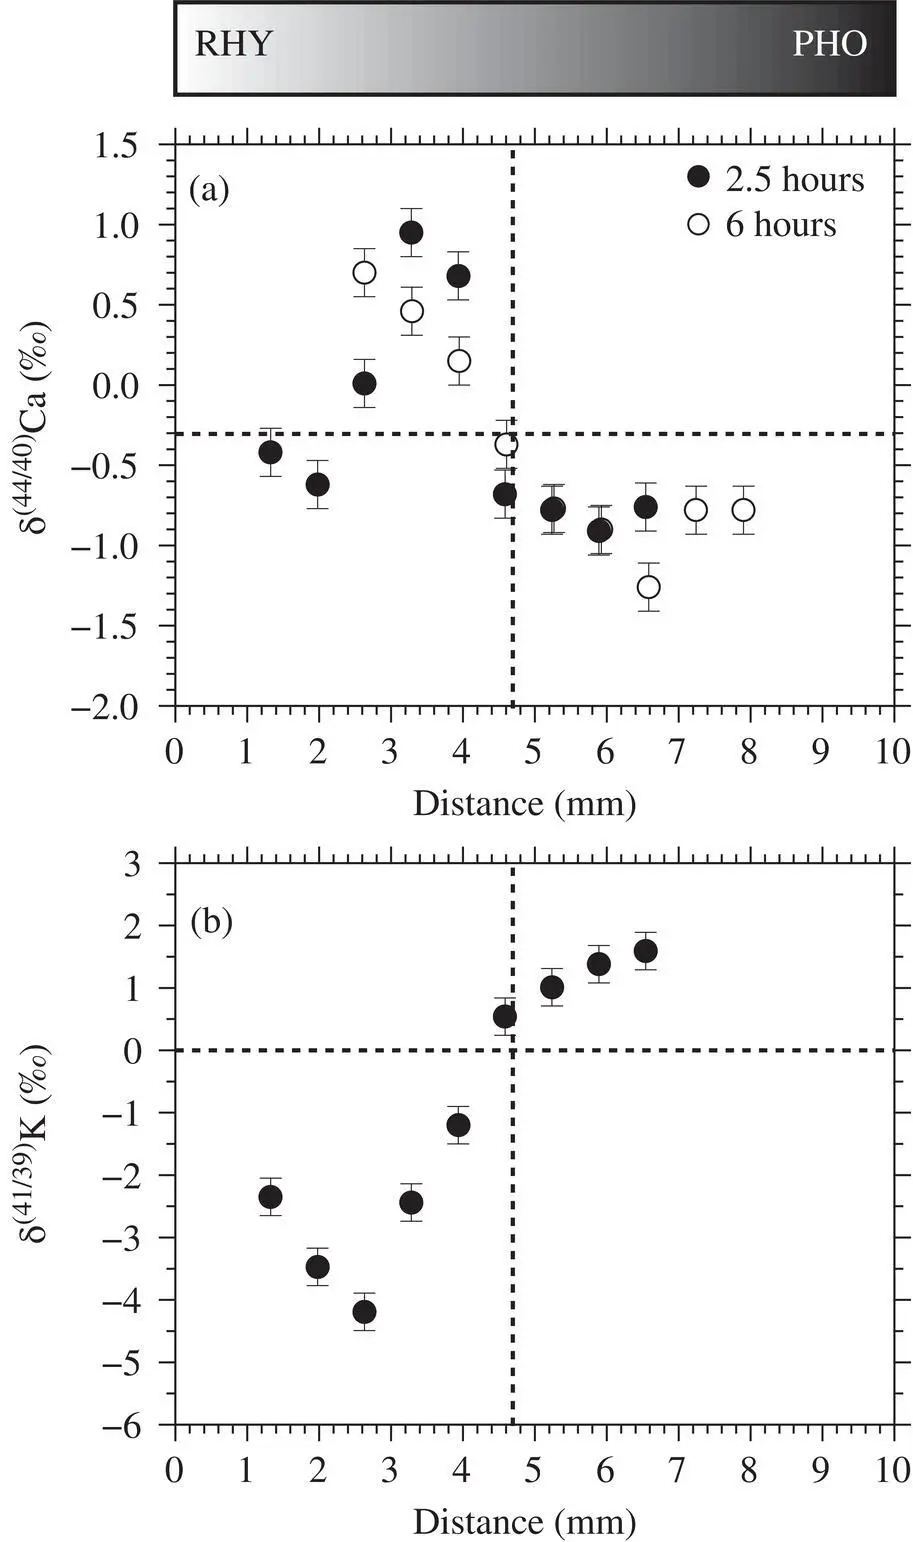
Figure 2.4 Isotopic profiles from two experiments lasting 2.5 hours and 6 hours. Note that the data have been shifted to the right by 1 mm and 2.3 mm for the 2.5 hour and 6 hour runs, respectively, in order to align the interfaces and frame the profiles within each panel.
For K isotopes, the shape of the profile resembles those of previous studies where the component of interest diffuses down a monotonic concentration gradient. The net K 2O flux is from phonolite to rhyolite, which is opposite the CaO flux, rendering the phonolite isotopically heavy and the rhyolite isotopically light. Both ends of the diffusion couple have changed from the initial value because of the fast diffusion of the K 2O component reaching both ends of the capsule. The total range in δ 41K is about 6‰.
2.4. DISCUSSION
In the first study of its kind on this topic, Richter et al. (1999) performed diffusion couple experiments in the simplified CaO‐Al 2O 3‐SiO 2system and developed a theoretical framework whereby the magnitude of diffusive isotopic fractionations correlates positively with the initial concentration contrast between starting materials and the mass dependence on diffusivity. The results presented here, however, show that large diffusive isotope effects can arise even when the initial concentration contrast is very small, as is the case for CaO. Another peculiarity of this system is the extremely fast diffusion of K 2O, which appears to be largely decoupled from that of SiO 2. This bears similarities to the behavior of Li 2O in the basalt‐rhyolite experiments of Richter et al. (2003), but unlike Li 2O, K 2O is a major component, and because of requirements for mass and charge balance, its diffusion influences the profiles of all the other major elements either by dilution, enrichment, or diffusive coupling. Not only does K 2O diffuse rapidly, but it also exhibits large diffusive isotope effects despite there being only a 2 amu difference between 41K and 39K. In following sections, we adapt an existing framework that enables us to model the SiO 2, CaO, and K 2O profiles and to quantify the mass dependence on diffusion coefficients in order to place the phonolite‐rhyolite results in the context of previous studies.
2.5. MODELING
There are two classes of diffusion models that can explain complicated diffusion behavior in a multicomponent system. The first is a more general multicomponent diffusion model that invokes a matrix of diffusion coefficients (Onsager, 1945). The second is a form of effective binary diffusion model in which components diffuse in response to activity gradients, which in turn are given by the concentration of SiO 2(Richter, 1993; Zhang, 1993).
Читать дальшеИнтервал:
Закладка:
Похожие книги на «Isotopic Constraints on Earth System Processes»
Представляем Вашему вниманию похожие книги на «Isotopic Constraints on Earth System Processes» списком для выбора. Мы отобрали схожую по названию и смыслу литературу в надежде предоставить читателям больше вариантов отыскать новые, интересные, ещё непрочитанные произведения.


Обсуждение, отзывы о книге «Isotopic Constraints on Earth System Processes» и просто собственные мнения читателей. Оставьте ваши комментарии, напишите, что Вы думаете о произведении, его смысле или главных героях. Укажите что конкретно понравилось, а что нет, и почему Вы так считаете.