Isotopic Constraints on Earth System Processes
Здесь есть возможность читать онлайн «Isotopic Constraints on Earth System Processes» — ознакомительный отрывок электронной книги совершенно бесплатно, а после прочтения отрывка купить полную версию. В некоторых случаях можно слушать аудио, скачать через торрент в формате fb2 и присутствует краткое содержание. Жанр: unrecognised, на английском языке. Описание произведения, (предисловие) а так же отзывы посетителей доступны на портале библиотеки ЛибКат.
- Название:Isotopic Constraints on Earth System Processes
- Автор:
- Жанр:
- Год:неизвестен
- ISBN:нет данных
- Рейтинг книги:4 / 5. Голосов: 1
-
Избранное:Добавить в избранное
- Отзывы:
-
Ваша оценка:
Isotopic Constraints on Earth System Processes: краткое содержание, описание и аннотация
Предлагаем к чтению аннотацию, описание, краткое содержание или предисловие (зависит от того, что написал сам автор книги «Isotopic Constraints on Earth System Processes»). Если вы не нашли необходимую информацию о книге — напишите в комментариях, мы постараемся отыскать её.
Volume highlights include: Isotopic Constraints on Earth System Processes
The American Geophysical Union promotes discovery in Earth and space science for the benefit of humanity. Its publications disseminate scientific knowledge and provide resources for researchers, students, and professionals.
Isotopic Constraints on Earth System Processes — читать онлайн ознакомительный отрывок
Ниже представлен текст книги, разбитый по страницам. Система сохранения места последней прочитанной страницы, позволяет с удобством читать онлайн бесплатно книгу «Isotopic Constraints on Earth System Processes», без необходимости каждый раз заново искать на чём Вы остановились. Поставьте закладку, и сможете в любой момент перейти на страницу, на которой закончили чтение.
Интервал:
Закладка:
2.2. METHODS
2.2.1. Experiments
Two rock compositions used for the diffusion couple experiments were chosen on the basis of being as different from each other as possible while having similar CaO but different K 2O. The compositions that best matched these criteria are a high‐CaO rhyolite with 70 wt% SiO 2and a phonolite with 55 wt% SiO 2( Table 2.1). The rhyolite was supplied by Shaun Brown and comes from Chuginadak Island in the Aleutians (Sample ID FMI‐6; Yogodzinski et al., 2010) and the phonolite was collected in 2002 by JMW from the northern Black Hills tertiary magmatic province. The two compositions have nearly identical CaO (2.9 wt% versus 3.0 wt%) and the large difference in SiO 2is balanced mostly by the extremely high K 2O (10.4 wt%) and high Al 2O 3(19 wt%) of the phonolite ( Figure 2.1).
Approximately 0.055 grams of rock powder from each sample were tamped into a graphite capsule, with the higher density phonolite on the bottom to ensure gravitational stability. The capsule was capped with a graphite plug and graphite lid and loaded into a standard 3/4‐inch piston‐cylinder assembly ( Fig. 2.2). The assembly was cold‐pressurized to 12.8 kbar and then brought to 1450 °C at a ramp rate of 150 °C/min. During the ramp, pressure increased initially due to thermal expansion but ultimately decreased to nearly the target pressure of 10 kbar and was brought to the target pressure through manual adjustments. Once the target temperature was reached, it was held at constant temperature (± 2 °C) and pressure (± 0.2 kbar) for the dwell time. To end a run, the power was turned off and the sample cooled to below the glass transition within a few seconds and to 130 °C in about 30 seconds.
Table 2.1 Major element composition of starting materials (fused glasses) measured by electron microprobe.
| Oxide | Rhyolite ( n =13 spots) | Phonolite ( n =14 spots) |
|---|---|---|
| SiO 2 | 70.06 | 54.88 |
| Al 2O 3 | 14.75 | 19.10 |
| CaO | 2.88 | 3.01 |
| FeO | 3.93 | 4.93 |
| MgO | 0.89 | 1.38 |
| K 2O | 2.86 | 10.43 |
| Na 2O | 5.39 | 5.47 |
| TiO 2 | 0.59 | 0.90 |
| P 2O 5 | 0.10 | 0.35 |
| MnO | 0.08 | 0.10 |
| Total | 101.09 | 100.27 |
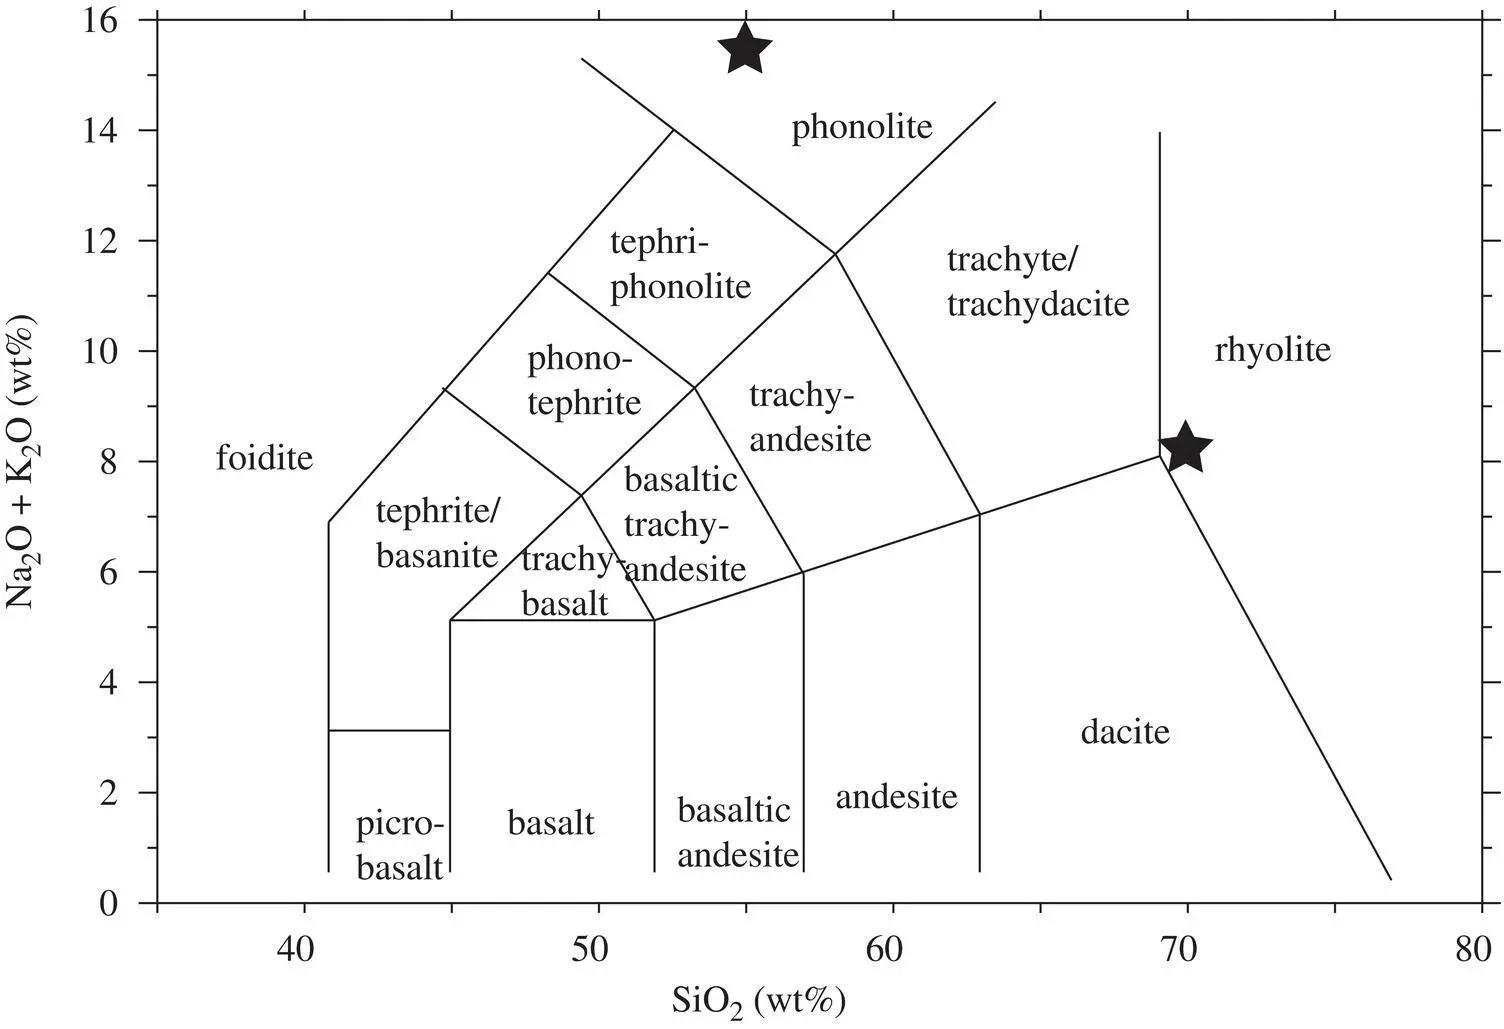
Figure 2.1 Alkali‐silica diagram showing the coordinates of the two starting materials used in the diffusion couple experiments.
2.2.2. Electron Microprobe Analyses
Each diffusion couple was extracted and sectioned down its vertical axis, mounted in a 1‐inch epoxy puck, and polished to 0.25 μm. After mounting, we measured the length of the diffusion couples and note that each one had compressed from an initial length of 10.4 mm down to about 6.6 mm. Axis‐parallel major‐element diffusion profiles were measured from end‐to‐end with a JEOL JXA‐8200 SuperProbe at Lawrence Livermore National Laboratory using a 15 nA beam current rastered at 12000× magnification (12 μm × 9 μm beam dimensions) with an accelerating voltage of 15 kV. Sodium was measured first at each spot to mitigate effects of Na migration. All electron probe data are provided as an Excel file in the Electronic Supplement.
2.2.3. Ca Isotopic Measurements
After microprobe measurements, diffusion couples were sectioned into wafers, about 465 μm thick and weighing about 3 mg, using a Bico diamond wafer saw with blade thickness of 165 μm. The wafers were dissolved in a mixture of hydrofluoric and perchloric acid, dried at 165 °C, redissolved in 5 mL 3N HNO 3, aliquotted, mixed with a 42Ca‐ 48Ca double spike to correct for spectrometer‐induced mass discrimination (cf. Watkins, 2010), dried to a small bead, and the bead was redissolved in 100 μL 3N HNO 3for loading onto cation exchange columns. The Ca fraction was separated and collected by cation exchange chromotography using Eichrom Ca‐spec DGA resin. The non‐Ca fraction was saved for subsequent K isotope work. About 3 μg of purified Ca from each sample were loaded onto a zone‐refined Re filament, dried down, topped with 1 μL of 20% of H 3PO 4acid and re‐dried.
Ca isotopes were measured by thermal ionization mass spectrometry (TIMS) at UC‐Berkeley on a Thermo‐Finnegan Triton TI with nine moveable Faraday collectors. For each sample, at least 100 isotope ratio measurements were made to reduce within‐run uncertainties to ± 0.04‰. At the time these data were collected in 2009, the long‐term uncertainty in the standard (SRM 715) was conservatively estimated to be ± 0.15‰, and we use this value for the error bars. The Ca isotope ratios of the samples were determined using an iterative spike subtraction algorithm and are reported as (Skulan et al., 1997):
(2.1) 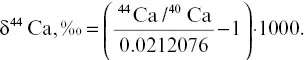
The Ca isotope compositions are provided in Table 2.2.
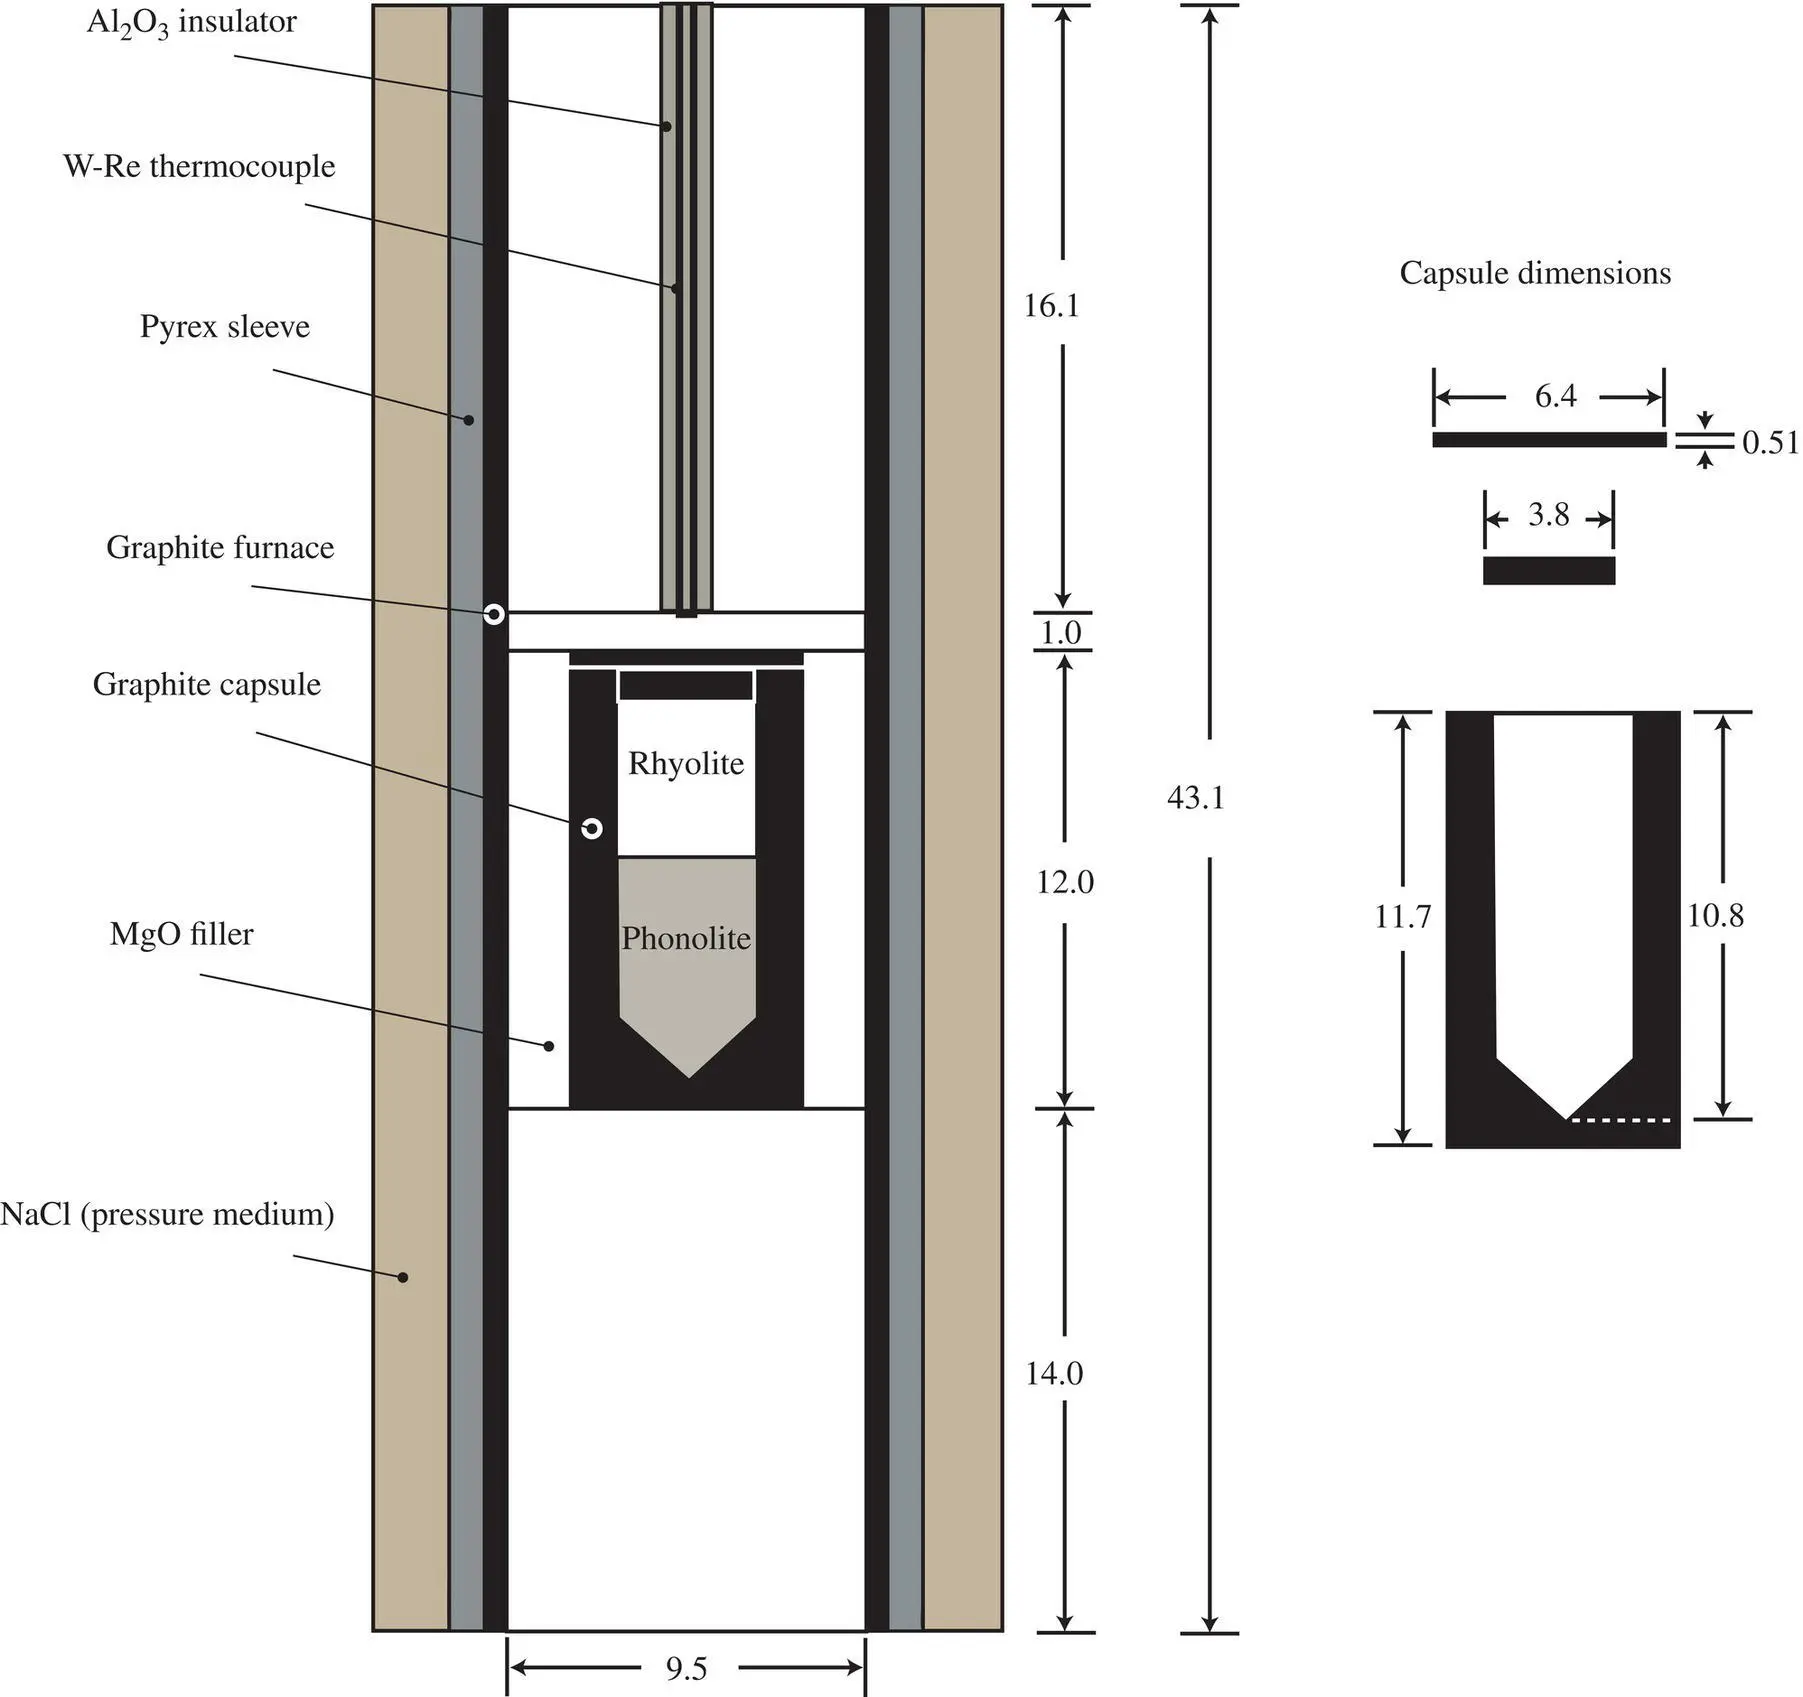
Figure 2.2 Piston‐cylinder sample assembly used for the diffusion couple experiments. All dimensions are in millimeters.
2.2.4. K Isotopic Measurements
Potassium was separated for isotopic analysis from the sample solutions after Ca separation using columns loaded with 1.8 ml of AG30x8 cation resin. Sample aliquots with ∼600 ng K were dried down, taken up in 300 μL of 1 M HNO 3, loaded on the columns, eluted with 1 M HNO 3, and the K fraction was collected (Bourg et al., 2010). After drying the separated K solutions down, the K residue was brought up in 0.3 N HNO 3to a concentration of 400 ppb. The 41K/ 39K ratios of the separated K were measured using a multi‐collector ICP sourced mass spectrometer (IsoProbe, GV Instruments Ltd.) at Lawrence Berkeley National Lab. The IsoProbe is equipped with a RF hexapole ion‐guide that allows the introduction of gasses to provide both energy focusing as well the removal of isobaric interferences arising from Ar ions. In the case of the K isotopic measurements reported here, He and H 2were introduced to the hexapole region at rates of 10 mL/min and 1 mL/min, respectively, to suppress mass interferences from Ar isotopes. For K isotopic measurements, a standard‐sample bracketing technique was employed using an in‐house K reference (K spectroscopic standard, ULTRA Scientific) matching the sample unknowns in concentration (Christensen et al., 2018). The potassium isotopic composition is reported as:
Table 2.2 Summary of isotopic results.
| Sample | Distance (mm) | δ 44Ca | n | δ 41K | n |
|---|---|---|---|---|---|
| RP2–1 | 0.33 | 0.70 | 2 | – | – |
| RP2–2 | 0.99 | 0.46 | 5 | – | – |
| RP2–3 | 1.65 | 0.15 | 4 | – | – |
| RP2–4 | 2.31 | –0.37 | 2 | – | – |
| RP2–5 | 2.97 | –0.77 | 2 | – | – |
| RP2–6 | 3.62 | –0.90 | 2 | – | – |
| RP2–7 | 4.28 | –1.26 | 2 | – | – |
| RP2–8 | 4.94 | –0.78 | 2 | – | – |
| RP2–9 | 5.60 | –0.78 | 2 | – | – |
| RP2–10 | 6.26 | – | – | – | – |
| RP3–1 | 0.33 | –0.42 | 3 | –2.35 | – |
| RP3–2 | 0.98 | –0.62 | 3 | –3.47 | – |
| RP3–3 | 1.63 | 0.01 | 2 | –4.19 | – |
| RP3–4 | 2.28 | 0.95 | 2 | –2.44 | – |
| RP3–5 | 2.93 | 0.68 | 2 | –1.2 | – |
| RP3–6 | 3.59 | –0.68 | 2 | 0.54 | – |
| RP3–7 | 4.24 | –0.78 | 2 | 1.01 | – |
| RP3–8 | 4.89 | –0.91 | 2 | 1.38 | – |
| RP3–9 | 5.54 | –0.76 | 2 | 1.59 | – |
| RP3–10 | 6.19 | – | – | – | – |
| Rhyolite | – | –0.29 | 3 | – | – |
| Phonolite | – | –0.36 | 4 | – | – |
(2.2) 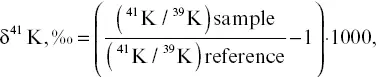
Интервал:
Закладка:
Похожие книги на «Isotopic Constraints on Earth System Processes»
Представляем Вашему вниманию похожие книги на «Isotopic Constraints on Earth System Processes» списком для выбора. Мы отобрали схожую по названию и смыслу литературу в надежде предоставить читателям больше вариантов отыскать новые, интересные, ещё непрочитанные произведения.


Обсуждение, отзывы о книге «Isotopic Constraints on Earth System Processes» и просто собственные мнения читателей. Оставьте ваши комментарии, напишите, что Вы думаете о произведении, его смысле или главных героях. Укажите что конкретно понравилось, а что нет, и почему Вы так считаете.