Stephen W. S. McKeever - A Course in Luminescence Measurements and Analyses for Radiation Dosimetry
Здесь есть возможность читать онлайн «Stephen W. S. McKeever - A Course in Luminescence Measurements and Analyses for Radiation Dosimetry» — ознакомительный отрывок электронной книги совершенно бесплатно, а после прочтения отрывка купить полную версию. В некоторых случаях можно слушать аудио, скачать через торрент в формате fb2 и присутствует краткое содержание. Жанр: unrecognised, на английском языке. Описание произведения, (предисловие) а так же отзывы посетителей доступны на портале библиотеки ЛибКат.
- Название:A Course in Luminescence Measurements and Analyses for Radiation Dosimetry
- Автор:
- Жанр:
- Год:неизвестен
- ISBN:нет данных
- Рейтинг книги:4 / 5. Голосов: 1
-
Избранное:Добавить в избранное
- Отзывы:
-
Ваша оценка:
A Course in Luminescence Measurements and Analyses for Radiation Dosimetry: краткое содержание, описание и аннотация
Предлагаем к чтению аннотацию, описание, краткое содержание или предисловие (зависит от того, что написал сам автор книги «A Course in Luminescence Measurements and Analyses for Radiation Dosimetry»). Если вы не нашли необходимую информацию о книге — напишите в комментариях, мы постараемся отыскать её.
A Course in Luminescence Measurements and Analyses for Radiation Dosimetry — читать онлайн ознакомительный отрывок
Ниже представлен текст книги, разбитый по страницам. Система сохранения места последней прочитанной страницы, позволяет с удобством читать онлайн бесплатно книгу «A Course in Luminescence Measurements and Analyses for Radiation Dosimetry», без необходимости каждый раз заново искать на чём Вы остановились. Поставьте закладку, и сможете в любой момент перейти на страницу, на которой закончили чтение.
Интервал:
Закладка:
Also to be noted is that Equations 2.10and 2.11are highly dependent on temperature, and thus a localized level that is a trap at high temperatures, may be a recombination center at lower temperatures. The weaker temperature dependencies of the attempt-to-escape frequencies and the cross-sections are less significant than the exponential dependence on T .
The processes of trapping and recombination are represented schematically in Figure 2.7 based on the energy band model for a crystalline solid. In the simple model represented in Figure 2.7 there is only one species of electron localized state and one species of hole localized state. It is further assumed that seexp{−EtekT}>nBhe and that shexp{−EthkT}
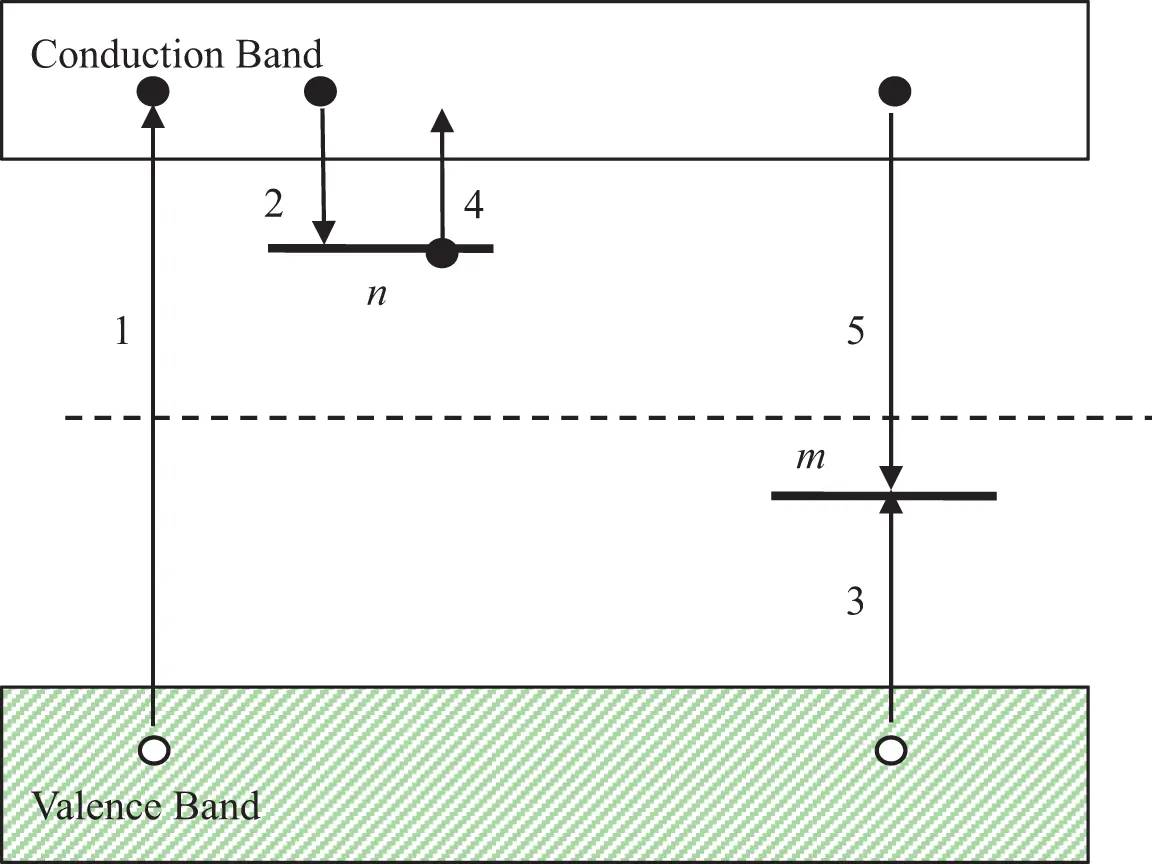
Figure 2.7 A simple model with one electron trap and one recombination center (the One-Trap/One-Recombination-Center, or OTOR, model). Transition (1) represents an ionization event in which one electron (black dot) is ionized from its host atom and becomes free to move throughout the crystal. At the same time, a free hole (open dot) is created in the valence band and it too becomes free to move. Transitions (2) and (3) represent trapping of the free electron and free hole at electron and hole traps respectively. In this model it is assumed that seexp{−EtekT}>nBhe and that shexp{−EthkT}
Exercise 2.1
(a) Consider an electron trap at energy E and energy depth Et = Ec – E (where Ec is the bottom of the conduction band). The total concentration of traps is N , of which n are filled with electrons. What will be the occupancy of this trap if E = EF ?
(b) If Nc is the density of available states in the conduction band, nc is the concentration of free electrons, ve is the thermal velocity of free electrons, and σ is the capture cross-section for the trap, show that the attempt-to-escape frequency, s is given by Equation 2.3. ( Hint : consider equilibrium between trap filling and trap emptying.)
(c) What is the expected T dependence of s ?
(d) If me*≈mh*, show that, at thermal equilibrium at T > 0 K, the Fermi Level lies mid-gap.
2.2.1.2 Optical Excitation
If, instead of heating a material, the trapped electrons are released from their traps via absorption of energy from photons, Equation 2.1now becomes:
 (2.12)
where Φ is the intensity of the stimulating light (in units of m –2s –1) and σp(E) is the photoionization cross-section (m 2) for a stimulation energy E . If Eo is the threshold photon energy required to excite the electron from the trap (i.e. the optical trap depth) one might expect Eo = Et , that is, the thermal trap depth Et and the optical trap depth Eo are the same. However, thermal energy is also absorbed by lattice phonons such that:
 (2.13)
where Eph is the phonon energy given by:
 (2.14)
Here, S is the Huang-Rhys factor, h is Planck’s constant and vph is the phonon vibration frequency.
The usual way to consider the differences between the optical trap depth Eo and the thermal trap depth Et , is to use the configurational coordinate diagram, shown in Figure 2.8, where potential energy curves for the electron in the trap Eg ( Q ) and in the conduction band Ee ( Q ) are expressed as a function of the configurational coordinate Q of the system. Once the electron is excited into the conduction band, the charge state of the localized trap changes by +1 and significant lattice relaxation can occur. However, the Franck-Condon principle dictates that optical transitions occur without changes in the configuration and lattice relaxation only occurs once the electron is in its excited state. This is illustrated in Figure 2.8 by the vertical transition A→B, with energy Eo . After lattice relaxation, the excited electron loses an amount of energy Eph , transition B→C. Thermal transitions, on the other hand allow for lattice relaxations and the net energy required is shown as Et in the figure, with the transition A→C. Et and Eo are related as in Equation 2.13. Estimates reveal Eo/Et≈εo/ε, where εo and ε are the high frequency and static dielectric constants, respectively (Mott and Gurney 1948).
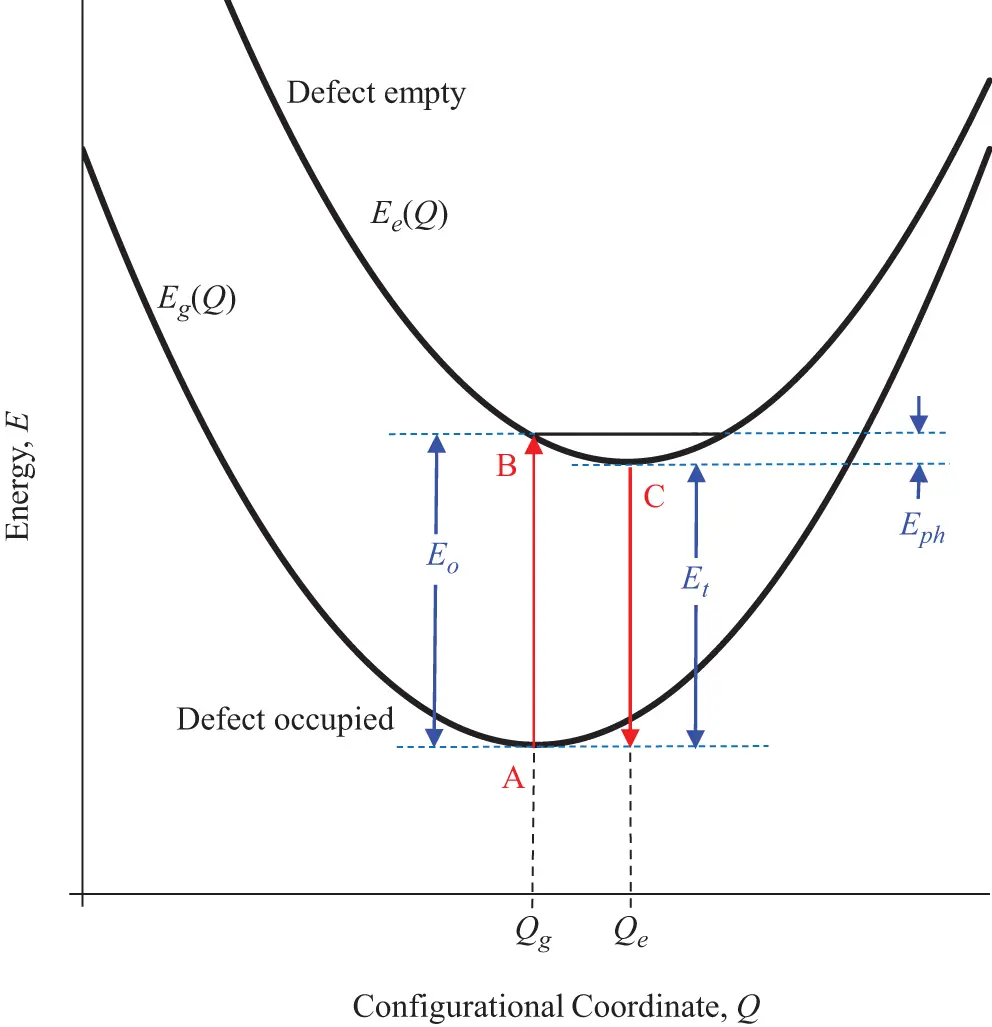
Figure 2.8 A configurational coordinate diagram showing the potential energy curves Eg ( Q ) and Ee ( Q ) in the region of the defect when the defect state is occupied by an electron, and when it is empty (ionized). When the level is occupied the energy is a minimum at configurational coordinate Qg . Optical transitions take place vertically (transition AB) since the lattice does not have time to respond to the change in charge state of the defect and relax to its new configurational coordinate. The optical energy required to affect this transition is Eo . Once ionized, the lattice relaxes to new coordinate Qe and a new energy minimum at C, following emission of phonons of energy Eph . Lattice relaxations are allowed during thermal excitations, however, and thermal stimulation can cause transitions directly from A to C. The required thermal energy is Et , where Et=Eo – Eph.
The form of the photoionization cross-section function σp(E) depends upon several material-related factors and different models exist to describe it. The first point to remember is that it is a function, and its value depends on the wavelength of the stimulating light used to excite the electrons from their traps. Thus, if broad-band, polychromatic excitation light is used, the photoionization cross-section will be multivalued. At first glance, one might expect that the function might be a step function since as long as the photon energy E=hv>Eo, trap ionization will occur, whereas if hvZ ( E ) and a peak in the value of σp is usually observed as the photon energy becomes too large for the corresponding states into which the electron could be excited. Furthermore, strong phonon coupling of the trapped electron to the lattice can give rise to excitation even if hν
The various expressions for photoionization cross-section σp(E) depend upon assumptions relating to the potential energy in the vicinity of the defect, the wavefunctions for the trapped and delocalized states, the density of states in the delocalized band, and the degree of phonon interaction. For a shallow (hydrogenic) electron trap:
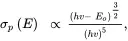 (2.15)
where E=hv is the energy of the stimulating light (Blakemore and Rahimi 1984; Landsberg 2003). The coulombic attraction between the freed electron and the ionized defect is ignored when hv is just larger than Eo . The cross-section reaches its maximum at hv=1.4 Eo.
Читать дальшеИнтервал:
Закладка:
Похожие книги на «A Course in Luminescence Measurements and Analyses for Radiation Dosimetry»
Представляем Вашему вниманию похожие книги на «A Course in Luminescence Measurements and Analyses for Radiation Dosimetry» списком для выбора. Мы отобрали схожую по названию и смыслу литературу в надежде предоставить читателям больше вариантов отыскать новые, интересные, ещё непрочитанные произведения.


Обсуждение, отзывы о книге «A Course in Luminescence Measurements and Analyses for Radiation Dosimetry» и просто собственные мнения читателей. Оставьте ваши комментарии, напишите, что Вы думаете о произведении, его смысле или главных героях. Укажите что конкретно понравилось, а что нет, и почему Вы так считаете.