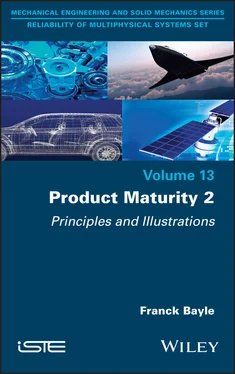
1 Cover
2 Title Page Reliability of Multiphysical Systems Set coordinated by Abdelkhalak El Hami Volume 13
3 Copyright First published 2022 in Great Britain and the United States by ISTE Ltd and John Wiley & Sons, Inc. Apart from any fair dealing for the purposes of research or private study, or criticism or review, as permitted under the Copyright, Designs and Patents Act 1988, this publication may only be reproduced, stored or transmitted, in any form or by any means, with the prior permission in writing of the publishers, or in the case of reprographic reproduction in accordance with the terms and licenses issued by the CLA. Enquiries concerning reproduction outside these terms should be sent to the publishers at the undermentioned address: ISTE Ltd 27-37 St George’s Road London SW19 4EU UK www.iste.co.uk John Wiley & Sons, Inc. 111 River Street Hoboken, NJ 07030 USA www.wiley.co © ISTE Ltd 2022 The rights of Franck Bayle to be identified as the author of this work have been asserted by him in accordance with the Copyright, Designs and Patents Act 1988. Any opinions, findings, and conclusions or recommendations expressed in this material are those of the author(s), contributor(s) or editor(s) and do not necessarily reflect the views of ISTE Group. Library of Congress Control Number: 2021952701 British Library Cataloguing-in-Publication Data A CIP record for this book is available from the British Library ISBN 978-1-78630-740-8
4 Foreword by Laurent Denis
5 Foreword by Serge Zaninotti
6 Acknowledgements
7 Introduction
8 1 Sampling in Manufacturing
1.1. Cost aspects
1.2. Considering the distribution of defects
1.3. Considering the test coverage
9 2 Compliance Test
10 3 Non-Regression Tests
3.1. Non-regression on a physical quantity
3.2. Non-regression depending on time
11 4 Zero-Failure Reliability Demonstration
4.1. Purpose of zero-failure tests 4.2. Theoretical principle
4.3. Optimization of test costs
4.4. Specific cases
12 5 Reliability Management
5.1. Context 5.2. Physical architecture division
5.3. Classification of subsets
5.4. Allocation of initial reliability
5.5. Estimation of the reliability of subsets
5.6. Optimal allocation of the reliability of subsets
5.7. Illustration
5.8. Definition of design rules
5.9. Construction of a global predicted reliability model with several manufacturers
13 6 Confirmation of Maturity
6.1. Internal data from equipment manufacturer
6.2. System manufacturer data
6.3. End-customer data
6.4. Burn-in optimization
14 List of Notations
15 List of Definitions
16 List of Acronyms
17 References
18 Index
19 End User License Agreement
1 Chapter 1 Figure 1.1. Evolution of the total average cost depending on the size of the sam...
Figure 1.2. Evolution of the total average cost depending on the size of the sam...
Figure 1.3. Evolution of the total average cost depending on the size of the sam...
Figure 1.4. Evolution of the total average cost depending on the sample size – E...
Figure 1.5. Evolution of the total average cost depending on the sample size – E...
Figure 1.6. Evolution of the total average cost depending on the sample size – E...
Figure 1.7. Illustration
2 Chapter 2Figure 2.1. Overview diagram of the non-compliance testFigure 2.2. Test of normality
3 Chapter 3Figure 3.1. Overview diagram of non-regression on a physical quantityFigure 3.2. Test of normality on variable 1Figure 3.3. Test of normality on variable 2Figure 3.4. Diagram of a non-regression testFigure 3.5. Example of a non-regression test
4 Chapter 4Figure 4.1. Example of demonstration of reliability of non-maintained productsFigure 4.2. Testing time depending on the number of parts of non-maintained prod...Figure 4.3. Example of reliability demonstration for maintained productsFigure 4.4. Testing time depending on the number of parts of maintained productsFigure 4.5. Weibull plot for the welding strength during thermal cyclingFigure 4.6. Weibull plot of electrolytic capacitorsFigure 4.7. Example of optimum cost for tests of non-maintained productsFigure 4.8. Example of optimum cost of testing maintained productsFigure 4.9. Survival function for the two testsFigure 4.10. Example of MTBF demonstrated with two testsFigure 4.11. Demonstrated reliability under various conditionsFigure 4.12. Reliability demonstrated under various conditionsFigure 4.13. Principle of testing the same parts under different conditionsFigure 4.14. Temperature profile under different conditionsFigure 4.15. Objective failure rate
5 Chapter 5Figure 5.1. Overview diagram of product reliability managementFigure 5.2. Principle of product division into subsets (S/S)Figure 5.3. Example of how the proper manufacturing of coins can be verifiedFigure 5.4. Credibility curve example 5.1Figure 5.5. Credibility curve example 5.2Figure 5.6. Credibility curve example 5.3Figure 5.7. Illustration of reliability managementFigure 5.8. Initial reliability allocation of the subsets in case of reliability...Figure 5.9. Initial reliability allocation of the subsets in case of MTBF object...Figure 5.10. Reliability allocation of the subsets in case of reliability object...Figure 5.11. Reliability allocation of the subsets in case of MTBF objective aft...Figure 5.12. Weibull plot voltage reference reliability testFigure 5.13. 3D Weibull plot voltage reference reliability testFigure 5.14. Final reliability allocation of the subsets in case of reliability ...Figure 5.15. Final reliability allocation of the subsets in case of MTBF objecti...Figure 5.16. Establishment of design rulesFigure 5.17. Example of global failure rates for manufacturers of componentsFigure 5.18. Global weighted failure rate of manufacturers
6 Chapter 6Figure 6.1. Test cone exampleFigure 6.2. Global test coneFigure 6.3. Example of removal rate over a three-year delivery periodFigure 6.4. Removal rate over a sliding period of six monthsFigure 6.5. Example of removal rate with various sizes of sliding windowFigure 6.6. Overview diagram of how feedback data can be usedFigure 6.7. Root cause-based estimation of burn-in effectivenessFigure 6.8. Product maturity depending on parameter βFigure 6.9. Example of product maturityFigure 6.10. Example of product non-maturityFigure 6.11. Illustration of the component alert principleFigure 6.12. Example of the product that does not have the expected reliability ...Figure 6.13. Example of mature productFigure 6.14. Example of failure distribution over four HASS cyclesFigure 6.15. Example of failure distribution over four HASS cycles after optimiz...Figure 6.16. Example of evolution of the number of failures
1 Chapter 2Table 2.1. Example of data for a non-compliance test
2 Chapter 3Table 3.1. Example of a non-regression test
3 Chapter 4Table 4.1. Values of parameter β for mechanical componentsTable 4.2. Physical laws of failureTable 4.3. Activation energy according to the FIDES guideTable 4.4. Activation energies according to the JEDEC JEP122 standardTable 4.5. Activation energyTable 4.6. Activation energy according to EDR (2000)Table 4.7. Activation energy for TOSHIBA semiconductorsTable 4.8. Coffin–Manson coefficient according to (Livingston 2000)Table 4.9. Tests conducted on a quartz crystal according to the Automotive Elect...Table 4.10. Example of life profile with negligible thermal constant
4 Chapter 5Table 5.1. Classification of subsetsTable 5.2. Reliability estimation methods for the subsetsTable 5.3. Parameters of mission profile exampleTable 5.4. Results of the accelerated tests of reliabilityTable 5.5. Value of C and Ea parameters for different manufacturersTable 5.6. Values of C and Ea parameters for different manufacturers and associa...
Читать дальше


