Sharan B. Merriam - Learning in Adulthood
Здесь есть возможность читать онлайн «Sharan B. Merriam - Learning in Adulthood» — ознакомительный отрывок электронной книги совершенно бесплатно, а после прочтения отрывка купить полную версию. В некоторых случаях можно слушать аудио, скачать через торрент в формате fb2 и присутствует краткое содержание. Жанр: unrecognised, на английском языке. Описание произведения, (предисловие) а так же отзывы посетителей доступны на портале библиотеки ЛибКат.
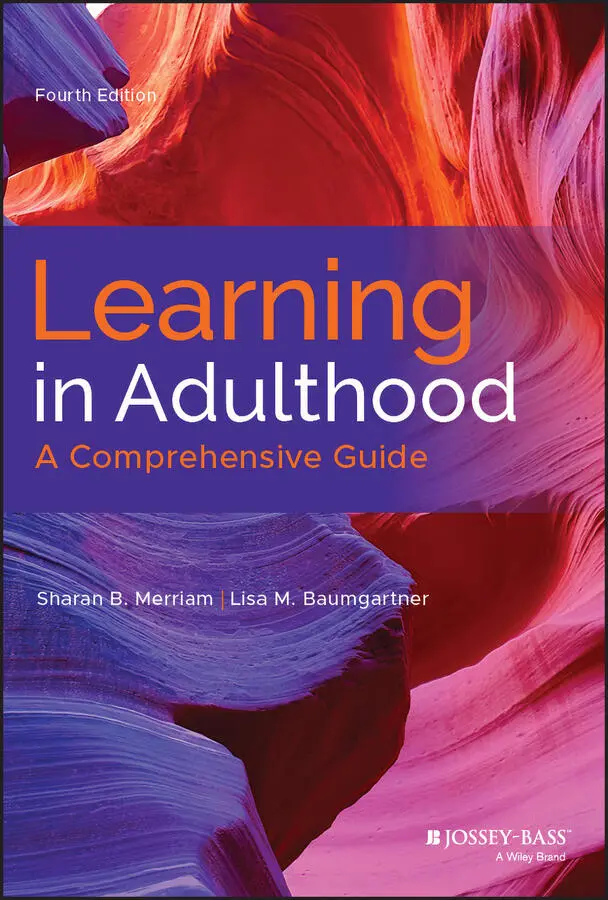
- Название:Learning in Adulthood
- Автор:
- Жанр:
- Год:неизвестен
- ISBN:нет данных
- Рейтинг книги:4 / 5. Голосов: 1
-
Избранное:Добавить в избранное
- Отзывы:
-
Ваша оценка:
Learning in Adulthood: краткое содержание, описание и аннотация
Предлагаем к чтению аннотацию, описание, краткое содержание или предисловие (зависит от того, что написал сам автор книги «Learning in Adulthood»). Если вы не нашли необходимую информацию о книге — напишите в комментариях, мы постараемся отыскать её.
has been the definitive guide in the field of adult education. Now in its fourth edition, this comprehensive volume is fully revised to reflect the latest developments in theory, research, and practice. The authors integrate foundational research and current knowledge to present fresh, original perspectives on teaching and learning in adulthood. Written by internationally-recognized experts, this market-leading guide draws from work in sociology, philosophy, critical social theory, psychology, and education to provide an inclusive overview of adult learning.
Designed primarily for educators of adults, this book is accessible for readers new to adult education, yet suitably rigorous for those more familiar with the subject. Content is organized into four practical parts, covering topics such as the social context of adult learning, self-directed and transformational learning, postmodern and feminist perspectives, cognitive development in adulthood, and more. Offering the most comprehensive single-volume treatment of adult learning available, this landmark text:
Offers a wide-ranging perspective on adult learning Synthesizes the latest thinking and work in the field Includes coverage of the sociocultural perspectives of adult learning Explores the broader social implications of adult education
is an indispensable resource for educators and administrators involved in teaching adults, as well as faculty and students in graduate programs in adult education.
Learning in Adulthood — читать онлайн ознакомительный отрывок
Ниже представлен текст книги, разбитый по страницам. Система сохранения места последней прочитанной страницы, позволяет с удобством читать онлайн бесплатно книгу «Learning in Adulthood», без необходимости каждый раз заново искать на чём Вы остановились. Поставьте закладку, и сможете в любой момент перейти на страницу, на которой закончили чтение.
Интервал:
Закладка:
b Interpret data with caution; coefficient of variation is 50% or more.
1Includes those enrolled only part time in college or university degree or certificate programs or those enrolled through a combination of part-time and full-time enrollments in the 12 months prior to the interview.
2Includes those enrolled only part time in vocational or technical diploma, degree, certificate programs, or those enrolled through a combination of part-time and full-time enrollments in the 12 months prior to the interview.
What these national surveys show is that 50 years after Johnstone and Rivera's original study, the profile of the typical adult learner remains stable. Compared to those who do not participate, participants in adult education are better educated, younger, and employed full-time and have higher incomes. But as Creighton and Hudson (2002) point out,
[A] closer look at participation in specific activities reveals some troubling signs of groups being left behind—especially Hispanics, those with lower levels of education, those with lower status jobs, and those who are employed part-time. … Thus, although the widespread increase in participation in adult education has been accompanied by an elimination of some inequities, in many cases the highly educated and high status groups that have been the traditional beneficiaries of adult education remain the main beneficiaries today. (p. ix)
Even more recent national surveys of adult participation in learning conducted in Great Britain reveal much the same patterns. For over 20 years an annual survey has been conducted first by the National Institute of Adult Continuing Education (NIACE), which then merged with the Learning and Work Institute (L&W). The annual study surveys a national representative sample of approximately 5,000 adults and asks who participates, their motivations, barriers, and benefits experienced. Results from the 2017 survey reveal approximately 40% participate in learning activities; women had a higher participation rate than men as did those of higher socioeconomic status. The main reason for learning is work or career related; adults over 65 or retired reported being motivated to learn for leisure or personal interest. Not surprisingly, over half (55%) reported learning in a work setting. The report includes a number of recommendations for policy and practice such as targeting “adults in lower social grades, adults who are furthest from the labour market, older adults, and those who left full-time education at their earliest opportunity” (Egglestone, Stevens, Jones, & Aldridge, 2018, p. 9).
Nonformal and Informal Participation
As noted earlier, studies of participation most often focus on formal educational institutions or employer-sponsored programs. Partly because of definitional problems, it has been more difficult to assess participation in nonformal or informal learning activities. The first statistics that we have on informal learning are again from the Johnstone and Rivera (1965) study in which they included “self-taught” or independent learning activities. Included almost as an afterthought, the authors admit that the “most surprising” estimate in their study was the “close to nine million persons who were active in independent studies.” Further, “the incidence of self-education throughout the adult population is much greater than we had anticipated” (p. 37).
The 2001 NCES study of participation was the first NCES study to include informal learning in the workplace as one form of participation. “Work-related informal learning activities included supervised training or mentoring, self-paced study using books or videotapes, self-paced study using computers, attending ‘brown-bag’ or informal presentations, attending conferences or conventions, and reading professional journals or magazines” (Kim, Collins Hagedorn, Williamson, & Chapman, 2004, p. vi). An astounding 63% of adults reported participating in informal workplace learning. However, as with the overall participation profile, “those adults with some college or more education, those in professional or managerial occupations, and those with higher household incomes were generally more likely to participate in work-related informal learning activities” (p. xii). But unlike participation in formal education, males participated more than females (67 versus 59%) and Whites more than Hispanics (no significant differences were observed when comparing Black adults with White or Hispanic adults).
The 2005 NCES study also attempted to capture what were labeled “informal learning activities for personal interest.” Participation in informal adult learning is particularly difficult to capture in surveys because of the various names it goes by (self-directed learning, autonomous learning, non-formal) and the fact that although there is every indication that informal learning is ubiquitous, learners often do not recognize it as a type of learning. Nevertheless, 70% of respondents in the NCES survey reported being engaged in informal learning activities (O'Donnell, 2006). The type of informal learning activities that participants could choose and the percentages of respondents who chose that type of activity are as follows: (a) computers and the Internet, 28%; (b) books, manuals, tapes, videos or TV, 47%; (c) magazines or other publications, 53%; (d) clubs or groups, 20%; and (e) conventions or conferences, 23%. There were no major differences among age groups or between men and women. As with formal education participation, those with more education and higher household income also had higher rates of participation in informal learning activities.
Although most adult educators suspect that the majority of adult learning is informal—that is, embedded in everyday life—it is particularly difficult to measure because most adults themselves have trouble identifying these episodes. One mechanism for assessing participation in informal learning has been through studies of self-directed learning. For example, Penland (1979) was interested in corroborating Tough's (1971) findings that more than 90% of adults are engaged in independent learning projects (see Chapter 6). Briefly, Tough felt that adults were engaged in learning as part of their everyday lives—learning that was not necessarily institutionally based and not easily recognized by the learners themselves because of the association of learning with formal instruction. Consequently, Tough and Penland asked adults to think about major learning activities that were clearly focused efforts to gain and retain knowledge or skill. A learning project had to have occurred over at least a two-day period, totaling at least 7 hours of learning. Respondents in both studies were given a list of things people learn about—a foreign language, gardening, raising children, and so on. Penland's 1,501 respondents were selected from the U.S. population by means of a modified probability sample. He found that “almost 80 percent (78.9) of the population of eighteen years and over perceive themselves as continuing learners whether in self-planned or formal courses” and “over three-quarters (76.1 percent) of the U.S. population had planned one or more learning projects on their own” (p. 173). Furthermore, of the nine areas of study, personal development and home and family ranked highest in popularity, followed by hobbies and recreation, general education, job, religion, voluntary activity, public affairs, and agriculture or technology.
Hamil-Luker and Uhlenberg (2002) studied participation in what they termed nonformal adult education activities—those sponsored by community organizations (libraries, neighborhood centers, community groups, religious organizations). Using the NCES databases from 1991 and 1999, they compared participation rates in three categories of provider—credential program (meaning educational institutions), business or industry, and community organizations. With one minor exception, participation increased for all age groups across the three providers. However, “by far the largest increase in adult education occurred in programs provided by community organizations, where participation rates more than doubled. Increases in these nonformal educational programs were fairly uniform across the age categories” (p. S327).
Читать дальшеИнтервал:
Закладка:
Похожие книги на «Learning in Adulthood»
Представляем Вашему вниманию похожие книги на «Learning in Adulthood» списком для выбора. Мы отобрали схожую по названию и смыслу литературу в надежде предоставить читателям больше вариантов отыскать новые, интересные, ещё непрочитанные произведения.










Обсуждение, отзывы о книге «Learning in Adulthood» и просто собственные мнения читателей. Оставьте ваши комментарии, напишите, что Вы думаете о произведении, его смысле или главных героях. Укажите что конкретно понравилось, а что нет, и почему Вы так считаете.