Bhisham C. Gupta - Statistics and Probability with Applications for Engineers and Scientists Using MINITAB, R and JMP
Здесь есть возможность читать онлайн «Bhisham C. Gupta - Statistics and Probability with Applications for Engineers and Scientists Using MINITAB, R and JMP» — ознакомительный отрывок электронной книги совершенно бесплатно, а после прочтения отрывка купить полную версию. В некоторых случаях можно слушать аудио, скачать через торрент в формате fb2 и присутствует краткое содержание. Жанр: unrecognised, на английском языке. Описание произведения, (предисловие) а так же отзывы посетителей доступны на портале библиотеки ЛибКат.

- Название:Statistics and Probability with Applications for Engineers and Scientists Using MINITAB, R and JMP
- Автор:
- Жанр:
- Год:неизвестен
- ISBN:нет данных
- Рейтинг книги:4 / 5. Голосов: 1
-
Избранное:Добавить в избранное
- Отзывы:
-
Ваша оценка:
Statistics and Probability with Applications for Engineers and Scientists Using MINITAB, R and JMP: краткое содержание, описание и аннотация
Предлагаем к чтению аннотацию, описание, краткое содержание или предисловие (зависит от того, что написал сам автор книги «Statistics and Probability with Applications for Engineers and Scientists Using MINITAB, R and JMP»). Если вы не нашли необходимую информацию о книге — напишите в комментариях, мы постараемся отыскать её.
Statistics and Probability with Applications for Engineers and Scientists using MINITAB, R and JMP, Second Edition Features two new chapters—one on Data Mining and another on Cluster Analysis Now contains R exhibits including code, graphical display, and some results MINITAB and JMP have been updated to their latest versions Emphasizes the p-value approach and includes related practical interpretations Offers a more applied statistical focus, and features modified examples to better exhibit statistical concepts Supplemented with an Instructor's-only solutions manual on a book’s companion website
is an excellent text for graduate level data science students, and engineers and scientists. It is also an ideal introduction to applied statistics and probability for undergraduate students in engineering and the natural sciences.
Statistics and Probability with Applications for Engineers and Scientists Using MINITAB, R and JMP — читать онлайн ознакомительный отрывок
Ниже представлен текст книги, разбитый по страницам. Система сохранения места последней прочитанной страницы, позволяет с удобством читать онлайн бесплатно книгу «Statistics and Probability with Applications for Engineers and Scientists Using MINITAB, R and JMP», без необходимости каждый раз заново искать на чём Вы остановились. Поставьте закладку, и сможете в любой момент перейти на страницу, на которой закончили чтение.
Интервал:
Закладка:
data = c(6, 8, 12, 9, 14, 18, 17, 23, 21, 23) #To obtain summary statistics summary(data)
| Min. | 1st Qu. | Median | Mean | 3rd Qu. | Max. |
| 6.00 | 9.75 | 15.50 | 15.10 | 20.25 | 23.00 |
#To obtain the mean, median, standard deviation, and variance mean(data)  15.1 median(data)
  15.5 sd(data)
  6.261878 var(data)
  39.21111 # To obtain the mode names(table(data))[table(data) == max(table(data))]
  “23”
“23”
PRACTICE PROBLEMS FOR SECTION 2.5
1 The data given below gives the viscosity of paper pulp measured over a period of 30 days:117.9117.7121.9116.8118.9121.2119.0117.5120.1122.6120.1124.1120.1118.4117.2121.7122.2122.0121.2120.4119.8121.6118.1119.3121.1119.6117.9119.4120.8122.1Determine the mean, median, and mode for these data.Determine the standard deviation for this sample data set.Use the results of part (a) to comment on the shape of the data.
2 Use the values of the mean () and the standard deviation () found in Problem 1 to determine the number of data points that fall in the intervals , , and . Assuming that the distribution of this data set is bell‐shaped, use the empirical rule to find the number of data points that you would expect to fall in these intervals. Compare the two results and comment.
3 Reconsider the data in Problem 4 of Section 2.3, reproduced below:253026262516212221271524192024163028242315152128181521272628171924262717271922271625163018Determine the mean and median for these data.Determine the standard deviation for these data.Determine what percentage of the data fall within 2.5 standard deviations of the mean.
4 Reconsider the data in Problem 5 of Section 2.3, reproduced here:148167171177175165134177168142126166130122157138163129143145141162147141164137149146132157Determine the mean and median for these data.Determine the range, variance, and the standard deviation for these sample data.Determine what percentage of the data fall within two standard deviations of the mean.
5 Reconsider the data in Problem 6 of Section 2.3, reproduced here:105101120116108112118119107100107120113113101102102100101100118106114100104101107113110100109108100104110113118100119120Determine the mean, median, and mode for these data.Determine the range, variance, and the standard deviation, for these data.
6 Use the values of the mean () and the standard deviation () found in part (a) of Problem 5 above to determine the number of data points that fall in the intervals, , , and . Assuming that the distribution of this data set is bell‐shaped, use the empirical rule to find the number of data points that you would expect to fall in these intervals. Compare the two results and comment.
7 John is a very hard‐working and an ambitious student. In a certain semester, he took in fact six courses that had 5, 4, 4, 3, 3, and 2 credit hours. The grade points he earned in these courses at the end of the semester were 3.7, 4.0, 3.3, 4.0, 3.7, and 4.0, respectively. Find his GPA for that semester.
8 The following data shows the tread depth in millimeters (mm) of 20 of tires selected randomly from a large shipment received by a dealer:6.287.066.506.766.826.926.867.156.576.486.646.946.497.147.167.107.086.486.406.54Find the mean and the median for these data.Find the variance and standard deviation for these data.If the desired tread depth on these tires is 7 mm, what you can say about the quality of these tires?
9 The average salary of engineers in a manufacturing company is $55,600 with a standard deviation of $4500. Assuming that the shape of the distribution of salaries is bell‐shaped, estimate the ranges of salaries within which approximately 68% and 95% of all the engineers' salaries are expected to fall.
10 According to Chebyshev's inequality, what we can say about the lower limit of the percentage of any set of data values that must lie within k standard deviations of the mean when (a) , (b) , (c) , (d) ?
11 Consider the following data giving the lengths (to the nearest centimeter) of a part used in the fuselage of a plane:2422232522212324202222242123232022242325Determine the mean () and the standard deviation () of these data.Calculate the intervals , , and .Determine the percentage of parts whose length lie within two and three standard deviations of the mean. Use these percentages to verify if the Chebyshev's inequality is valid.
2.6 Numerical Measures of Grouped Data
A set of data presented in the form of a frequency distribution table is called grouped data . So far, in this chapter, we have learned how to compute measures of centrality and measures of dispersion for ungrouped data. In this section, we will learn how to compute these measures for a grouped data.
Definition 2.6.1
The average of the lower and upper limits of a class (bin) is called the class midpoint or class mark .
To compute the measures of centrality and dispersion for a grouped data, each measurement in a given class is approximated by its midpoint. Thus, the measures computed from grouped data are only approximate values of measurements obtained from the original data. The actual approximation, of course, depends on the class width. Thus, in certain cases, the approximate values may be very close to the actual values, and in other cases, they may be very far apart. A word of caution: measurements obtained from grouped data should only be used when it is not possible to retrieve the original data.
2.6.1 Mean of a Grouped Data
In order to compute the average of a grouped data set, the first step is to find the midpoint (  ) of each class, which is defined as

Then, the population mean  and the sample average
  are defined as follows:
(2.6.1) 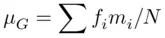
(2.6.2) 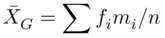
Here, summation is over the number of classes involved,  midpoint of the i th class,
  frequency of the i th class, that is, the number of values falling in the i th class,
  population size, and
  sample size.
Интервал:
Закладка:
Похожие книги на «Statistics and Probability with Applications for Engineers and Scientists Using MINITAB, R and JMP»
Представляем Вашему вниманию похожие книги на «Statistics and Probability with Applications for Engineers and Scientists Using MINITAB, R and JMP» списком для выбора. Мы отобрали схожую по названию и смыслу литературу в надежде предоставить читателям больше вариантов отыскать новые, интересные, ещё непрочитанные произведения.


Обсуждение, отзывы о книге «Statistics and Probability with Applications for Engineers and Scientists Using MINITAB, R and JMP» и просто собственные мнения читателей. Оставьте ваши комментарии, напишите, что Вы думаете о произведении, его смысле или главных героях. Укажите что конкретно понравилось, а что нет, и почему Вы так считаете.