Bhisham C. Gupta - Statistics and Probability with Applications for Engineers and Scientists Using MINITAB, R and JMP
Здесь есть возможность читать онлайн «Bhisham C. Gupta - Statistics and Probability with Applications for Engineers and Scientists Using MINITAB, R and JMP» — ознакомительный отрывок электронной книги совершенно бесплатно, а после прочтения отрывка купить полную версию. В некоторых случаях можно слушать аудио, скачать через торрент в формате fb2 и присутствует краткое содержание. Жанр: unrecognised, на английском языке. Описание произведения, (предисловие) а так же отзывы посетителей доступны на портале библиотеки ЛибКат.

- Название:Statistics and Probability with Applications for Engineers and Scientists Using MINITAB, R and JMP
- Автор:
- Жанр:
- Год:неизвестен
- ISBN:нет данных
- Рейтинг книги:4 / 5. Голосов: 1
-
Избранное:Добавить в избранное
- Отзывы:
-
Ваша оценка:
Statistics and Probability with Applications for Engineers and Scientists Using MINITAB, R and JMP: краткое содержание, описание и аннотация
Предлагаем к чтению аннотацию, описание, краткое содержание или предисловие (зависит от того, что написал сам автор книги «Statistics and Probability with Applications for Engineers and Scientists Using MINITAB, R and JMP»). Если вы не нашли необходимую информацию о книге — напишите в комментариях, мы постараемся отыскать её.
Statistics and Probability with Applications for Engineers and Scientists using MINITAB, R and JMP, Second Edition Features two new chapters—one on Data Mining and another on Cluster Analysis Now contains R exhibits including code, graphical display, and some results MINITAB and JMP have been updated to their latest versions Emphasizes the p-value approach and includes related practical interpretations Offers a more applied statistical focus, and features modified examples to better exhibit statistical concepts Supplemented with an Instructor's-only solutions manual on a book’s companion website
is an excellent text for graduate level data science students, and engineers and scientists. It is also an ideal introduction to applied statistics and probability for undergraduate students in engineering and the natural sciences.
Statistics and Probability with Applications for Engineers and Scientists Using MINITAB, R and JMP — читать онлайн ознакомительный отрывок
Ниже представлен текст книги, разбитый по страницам. Система сохранения места последней прочитанной страницы, позволяет с удобством читать онлайн бесплатно книгу «Statistics and Probability with Applications for Engineers and Scientists Using MINITAB, R and JMP», без необходимости каждый раз заново искать на чём Вы остановились. Поставьте закладку, и сможете в любой момент перейти на страницу, на которой закончили чтение.
Интервал:
Закладка:
5 The data below gives the time (in minutes) taken by 36 technicians to complete a small project:555846584946416059415943424044425846585840515949484642435648415456574843Construct a frequency distribution table for these data. Find the mean and the standard deviation of the grouped data, and then compare them with the actual mean and standard deviation (that is, the ungrouped and S) of these data.
2.7 Measures of Relative Position
This section introduces measures of relative position that divide the data into percentages to help locate any data value in the whole data set. Commonly used measures of relative position are percentiles and quartiles: percentiles divide the data into one hundred parts, such that each part contains at the most 1% of the data, and quartiles divide the data into four parts, such that each part contains at the most 25% of the data. Then from quartiles, we can derive another measure, which is called the interquartile range (IQR), to give the range of the middle 50% of the data values. This is obtained by first organizing the data in an ascending order and then trimming 25% of the data values from the lower and the upper ends. A quantile is a value which divide a distribution or an ordered sample such that a specified proportion of observations fall below that value. For instance, the percentiles and quartiles are very specific quantiles.
2.7.1 Percentiles
Percentiles divide the data into one hundred equal parts; each part contains at the most 1% of the data and is numbered from 1 to 99. For example, the median of a data set is the 50th percentile, which divides the data into two equal parts so that at most 50% of the data fall below the median and at most 50% of the data fall above it. The procedure for determining the percentiles is similar to the procedure used for determining the median. We compute the percentiles as follows:
1 Step 1. Write the data values in an ascending order and rank them from 1 to .
2 Step 2. Find the rank of the pth percentile (), which is given by (2.7.1)
3 Step 3. Find the data value that corresponds to the rank of the pth percentile.
We illustrate this procedure with the following example.
Example 2.7.1 (Engineers' salaries) The following data give the salaries (in thousands of dollars) of 15 engineers in a corporation:
62 48 52 63 85 51 95 76 72 51 69 73 58 55 54
1 Find the 70th percentile for these data.
2 Find the percentile corresponding to the salary of $60,000.
Solution:(a) We proceed as follows:
1 Step 1. Write the data values in the ascending order and rank them from 1 to 15.Salaries485151525455586263697273768595Ranks123456789101112131415
2 Step 2. Find the rank of the 70th percentile, which from (2.7.1) is given by
3 Step 3. Find the data value that corresponds to the ranks 11 and 12, which in this example are 72 and 73, respectively. Then, the 70th percentile is given byThus, the 70th percentile of the salary data is $72,200.That is, at most 70% of the engineers are making less than $72,200 and at most 30% of the engineers are making more than $72,200.
(b) Now we want to find the percentile  corresponding to a given value
  . This can be done by using the following formula:
(2.7.2) 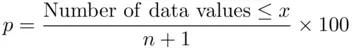
Thus, the percentile corresponding to the salary of $60,000 is
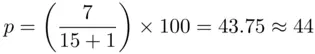
Hence, the engineer who makes a salary of $60,000 is at the 44th percentile. In other words, at most 44% of the engineers are making less than $60,000, or at most 56% are making more than $60,000.
2.7.2 Quartiles
In the previous discussion, we considered the percentiles that divide the data into 100 equal parts. Some of the percentiles have special importance, such as the 25th, 50th, and 75th percentiles. These percentiles are also known as the first, second, and third quartiles (denoted by  , and
, and  ), respectively. Sometimes, they are also known as the lower, middle, and upper quartiles, respectively. The second quartile is the same as the median. Thus, to determine the values of the different quartiles, one has to simply find the 25th, 50th, and 75th percentiles (see Figure 2.7.1).
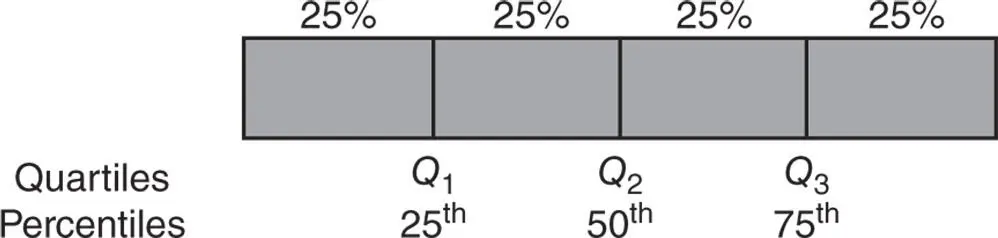
Figure 2.7.1Quartiles and percentiles.
2.7.3 Interquartile Range (IQR)
Often we are more interested in finding information about the middle 50% of a population. A measure of dispersion relative to the middle 50% of the population or sample data is known as the IQR . This range is obtained by trimming 25% of the values from the bottom and 25% of the values from the top. This is equivalent to finding the spread between the first quartile and the third quartile, which is IQR and is defined as
(2.7.3) 
Example 2.7.2(Engineers' salaries) Find the IQR for the salary data in Example 2.7.1:
Salaries: 48, 51, 51, 52, 54, 55, 58, 62, 63, 69, 72, 73, 76, 85, 95
Solution:In order to find the IQR, we need to find the quartiles  and
and  or equivalently 25th percentile and the 75th percentile. We can easily see that the ranks of 25th and 75th percentile are given by (see (2.7.1))


Consulting Step 3 of Example 2.7.1, we find that  (52 has rank 4) and
  (73 has rank 12). Thus, the middle 50% of the engineers earn between $52,000 and $73,000. The IQR in this example is given by
Интервал:
Закладка:
Похожие книги на «Statistics and Probability with Applications for Engineers and Scientists Using MINITAB, R and JMP»
Представляем Вашему вниманию похожие книги на «Statistics and Probability with Applications for Engineers and Scientists Using MINITAB, R and JMP» списком для выбора. Мы отобрали схожую по названию и смыслу литературу в надежде предоставить читателям больше вариантов отыскать новые, интересные, ещё непрочитанные произведения.


Обсуждение, отзывы о книге «Statistics and Probability with Applications for Engineers and Scientists Using MINITAB, R and JMP» и просто собственные мнения читателей. Оставьте ваши комментарии, напишите, что Вы думаете о произведении, его смысле или главных героях. Укажите что конкретно понравилось, а что нет, и почему Вы так считаете.