Bhisham C. Gupta - Statistics and Probability with Applications for Engineers and Scientists Using MINITAB, R and JMP
Здесь есть возможность читать онлайн «Bhisham C. Gupta - Statistics and Probability with Applications for Engineers and Scientists Using MINITAB, R and JMP» — ознакомительный отрывок электронной книги совершенно бесплатно, а после прочтения отрывка купить полную версию. В некоторых случаях можно слушать аудио, скачать через торрент в формате fb2 и присутствует краткое содержание. Жанр: unrecognised, на английском языке. Описание произведения, (предисловие) а так же отзывы посетителей доступны на портале библиотеки ЛибКат.

- Название:Statistics and Probability with Applications for Engineers and Scientists Using MINITAB, R and JMP
- Автор:
- Жанр:
- Год:неизвестен
- ISBN:нет данных
- Рейтинг книги:4 / 5. Голосов: 1
-
Избранное:Добавить в избранное
- Отзывы:
-
Ваша оценка:
Statistics and Probability with Applications for Engineers and Scientists Using MINITAB, R and JMP: краткое содержание, описание и аннотация
Предлагаем к чтению аннотацию, описание, краткое содержание или предисловие (зависит от того, что написал сам автор книги «Statistics and Probability with Applications for Engineers and Scientists Using MINITAB, R and JMP»). Если вы не нашли необходимую информацию о книге — напишите в комментариях, мы постараемся отыскать её.
Statistics and Probability with Applications for Engineers and Scientists using MINITAB, R and JMP, Second Edition Features two new chapters—one on Data Mining and another on Cluster Analysis Now contains R exhibits including code, graphical display, and some results MINITAB and JMP have been updated to their latest versions Emphasizes the p-value approach and includes related practical interpretations Offers a more applied statistical focus, and features modified examples to better exhibit statistical concepts Supplemented with an Instructor's-only solutions manual on a book’s companion website
is an excellent text for graduate level data science students, and engineers and scientists. It is also an ideal introduction to applied statistics and probability for undergraduate students in engineering and the natural sciences.
Statistics and Probability with Applications for Engineers and Scientists Using MINITAB, R and JMP — читать онлайн ознакомительный отрывок
Ниже представлен текст книги, разбитый по страницам. Система сохранения места последней прочитанной страницы, позволяет с удобством читать онлайн бесплатно книгу «Statistics and Probability with Applications for Engineers and Scientists Using MINITAB, R and JMP», без необходимости каждый раз заново искать на чём Вы остановились. Поставьте закладку, и сможете в любой момент перейти на страницу, на которой закончили чтение.
Интервал:
Закладка:
4 From the box plot in Figure 2.8.4, it is clear that the data do not contain any outliers.
5 In part (c), we concluded that the data are symmetric, so we can proceed to calculate the standard deviation and then determine whether or not the empirical rule holds.Thus, the standard deviation is . Now it can be seen that the intervalcontains 72.5% of the data and contains 100% of the data.
The data are slightly more clustered around the mean. But for all practical purposes, we can say that the empirical rule holds.
PRACTICE PROBLEMS FOR SECTIONS 2.7 AND 2.8
1 The following data give the amount of a beverage in 12 oz cans:11.3811.0311.8711.9812.3611.8012.3212.0611.3811.0712.1212.1112.2412.3711.7512.2513.6011.9313.1111.7612.3412.0811.8511.3712.3211.7412.7512.7612.1611.7210.9712.0912.5311.8812.1111.2812.0111.8012.4712.32Find the mean, variance, and standard deviation of these data.Find the three quartiles and the IQR for these data.Prepare a box plot for these data and determine if there are any outliers present in these data.
2 The following data gives the reaction time (in minutes) of a chemical experiment conducted by 36 chemistry majors:555846584946416059415942404442584658584051594846424356484154565748434943Find the mean, mode, and median for these data.Prepare a box plot for these data and check whether this data set contains any outliers.
3 The following data give the physics lab scores of 24 randomly selected of physics majors:211821182018185919202020191821581922191822182256Construct a box plot for these data and examine whether this data set contains any outliers.
4 The following data provide the number of six sigma black belt Engineers in 36 randomly selected manufacturing companies in the United States:736480677378667859797475736663626158657660796263717556787375636671746443Find the 60th percentile of these data.Find the 75th percentile of the data.Determine the number of data points that fall between the 60th and 75th percentiles you found in parts (a) and (b).Prepare the box plot for these data and comment on the shape of the data:
5 Consider the following two sets of data:Set I292425262324292924282327262120252430282829282226302126272523Set II464860435747425758595253415843504956575451466044554360505154504344535158Find the mean and standard deviation for the two data sets.Find the coefficient of variation for these data sets.Determine whether one of these data sets has higher variation than the other.
6 Reconsider the data in Problem 4 of Section 2.6, and do the following:Find the mean, variance, and standard deviation of these data.Find the three quartiles and the IQR for these data.Prepare a box plot for these data and determine if there are any outliers present in these data.
7 Reconsider the data in Problem 5 of Section 2.6and do the following:Find the mean, variance, and standard deviation of these data.Find the three quartiles and the IQR for these data.Prepare a box plot for these data and determine if there are any outliers present in these data.
2.9 Measures of Association
So far in this chapter, the discussion was focused on only univariate statistics because we were interested in studying a single characteristic of a subject. In all the examples we considered, the variable of interest was either qualitative or quantitative. We now study cases involving two variables; this means examining two characteristics of a subject. The two variables of interest could be either qualitative or quantitative, but here we will consider only variables that are quantitative.
For the consideration of two variables simultaneously, the data obtained are known as bivariate data. In the examination of bivariate data, the first question is whether there is any association of interest between the two variables. One effective way to determine whether there is such an association is to prepare a graph by plotting one variable along the horizontal scale ( x ‐axis) and the second variable along the vertical scale ( y ‐axis). Each pair of observations  is then plotted as a point in the xy ‐plane. The resulting graph is called a scatter plot . A scatter plot is a very useful graphical tool because it reveals the nature and strength of associations between two variables. The following example makes the concept of association clear.
Example 2.9.1(Cholesterol level and systolic blood pressure) The cholesterol level and the systolic blood pressure of 10 randomly selected US males in the age group 40–50 years are given in Table 2.1. Construct a scatter plot of this data and determine if there is any association between the cholesterol levels and systolic blood pressures.
Solution: Figure 2.9.1shows the scatter plot of the data in Table 2.1. This scatter plot clearly indicates that there is a fairly strong upward linear trend. Also, if a straight line is drawn through the data points, then it can be seen that the data points are concentrated around the straight line within a narrow band. The upward trend indicates a positive association between the two variables, while the width of the band indicates the strength of the association, which in this case is quite strong. As the association between the two variables gets stronger and stronger, the band enclosing the plotted points becomes narrower and narrower. A downward trend indicates a negative association between the two variables.
A numerical measure of association between two numerical variables is called the Pearson correlation coefficient , named after the English statistician Karl Pearson (1857–1936). Note that a correlation coefficient does not measure causation. In other words, correlation and causation are different concepts. Causation causes correlation, but not necessarily the converse. The correlation coefficient between two numerical variables in a set of sample data is usually denoted by r , and the correlation coefficient for population data is denoted by the Greek letter  (rho). The correlation coefficient r based on n pairs of
  , say
, say 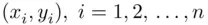 is defined as
(2.9.1) 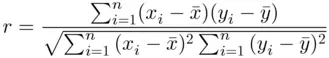
or
(2.9.2) 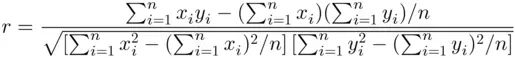
Table 2.9.1 Cholesterol levels and systolic BP of 10 randomly selected US males.
| Subject | 1 | 2 | 3 | 4 | 5 | 6 | 7 | 8 | 9 | 10 |
| Cholesterol ( x ) | 195 | 180 | 220 | 160 | 200 | 220 | 200 | 183 | 139 | 155 |
| Systolic BP ( y ) | 130 | 128 | 138 | 122 | 140 | 148 | 142 | 127 | 116 | 123 |
Интервал:
Закладка:
Похожие книги на «Statistics and Probability with Applications for Engineers and Scientists Using MINITAB, R and JMP»
Представляем Вашему вниманию похожие книги на «Statistics and Probability with Applications for Engineers and Scientists Using MINITAB, R and JMP» списком для выбора. Мы отобрали схожую по названию и смыслу литературу в надежде предоставить читателям больше вариантов отыскать новые, интересные, ещё непрочитанные произведения.


Обсуждение, отзывы о книге «Statistics and Probability with Applications for Engineers and Scientists Using MINITAB, R and JMP» и просто собственные мнения читателей. Оставьте ваши комментарии, напишите, что Вы думаете о произведении, его смысле или главных героях. Укажите что конкретно понравилось, а что нет, и почему Вы так считаете.