C. Philip Wheater - Practical Field Ecology
Здесь есть возможность читать онлайн «C. Philip Wheater - Practical Field Ecology» — ознакомительный отрывок электронной книги совершенно бесплатно, а после прочтения отрывка купить полную версию. В некоторых случаях можно слушать аудио, скачать через торрент в формате fb2 и присутствует краткое содержание. Жанр: unrecognised, на английском языке. Описание произведения, (предисловие) а так же отзывы посетителей доступны на портале библиотеки ЛибКат.

- Название:Practical Field Ecology
- Автор:
- Жанр:
- Год:неизвестен
- ISBN:нет данных
- Рейтинг книги:3 / 5. Голосов: 1
-
Избранное:Добавить в избранное
- Отзывы:
-
Ваша оценка:
Practical Field Ecology: краткое содержание, описание и аннотация
Предлагаем к чтению аннотацию, описание, краткое содержание или предисловие (зависит от того, что написал сам автор книги «Practical Field Ecology»). Если вы не нашли необходимую информацию о книге — напишите в комментариях, мы постараемся отыскать её.
The second edition of this popular text has updated reference material and weblinks, increased the number of case studies by 50% to illustrate the use of specific techniques in the field, added over 20% more figures (including 8 colour plates), and made more extensive use of footnotes to provide extra details. Extensions to topics covered in the first edition include additional discussion of: ethical issues; statistical methods (sample size estimation, use of the statistical package R, mixed models); bioindicators, especially for freshwater pollution; seeds, fecundity and population dynamics including static and dynamic life tables; forestry techniques including tree coring and tree mortality calculations; the use of data repositories; writing for a journal and producing poster and oral presentations. In addition, the use of new and emerging technologies has been a particular focus, including mobile apps for environmental monitoring and identification; land cover and GIS; the use of drones including legal frameworks and codes of practice; molecular field techniques including DNA analysis in the field (including eDNA); photo-matching for identifying individuals; camera trapping; modern techniques for detecting and analysing bat echolocation calls; and data storage using the cloud.
Divided into six distinct chapters,
begins at project inception with a chapter on planning—covering health and safety, along with guidance on how to ensure that the sampling and experimental design is suitable for subsequent statistical analysis. Following a chapter dealing with site characterisation and general aspects of species identification, subsequent chapters describe the techniques used to survey and census particular groups of organisms. The final chapters cover analysing, interpreting and presenting data, and writing up the research.
Offers a readable and approachable integrated guide devoted to field-based research projects Takes students from the planning stage, into the field, and clearly guides them through organism identification in the laboratory and computer-based data analysis, interpretation and data presentation Includes a chapter on how to write project reports and present findings in a variety of formats to differing audiences Aimed at undergraduates taking courses in Ecology, Biology, Geography, and Environmental Science,
will also benefit postgraduates seeking to support their projects.
Practical Field Ecology — читать онлайн ознакомительный отрывок
Ниже представлен текст книги, разбитый по страницам. Система сохранения места последней прочитанной страницы, позволяет с удобством читать онлайн бесплатно книгу «Practical Field Ecology», без необходимости каждый раз заново искать на чём Вы остановились. Поставьте закладку, и сможете в любой момент перейти на страницу, на которой закончили чтение.
Интервал:
Закладка:
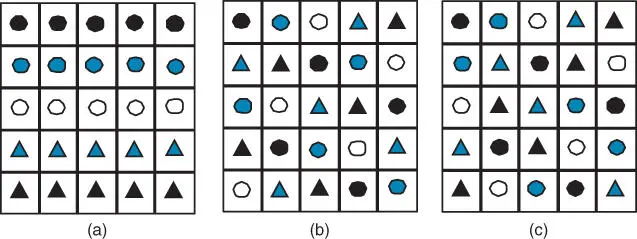
Figure 1.5 Experimental layouts for five different treatments. (a) Clustered design; (b) stratified design; (c) Latin square design. Each treatment is represented by a different symbol.
Planning statistical analysis
Although at this stage we will not discuss in detail the ways in which data are analysed, it is important to at least have sight of the likely methods that may be used (see Chapter 5for a more detailed coverage of statistical analysis). This is because different statistical methods are required to deal with different research questions. For example, if we were interested in trends over time, a regression model would seem appropriate; but if we were motivated to look for differences between treatments, then an ANOVA might be our test of choice. It should be noted that most statistical techniques require data to be gathered in a particular manner and so a lack of care at this stage could result in data being collected that cannot answer the question posed. It could also mean that some statistical methods cannot be used because the data do not meet the minimum number of observations that are needed to obtain meaningful results. This might also apply to those statistical approaches that require balanced designs (i.e. the same number of data points in each factor measured). In this section, we will discuss some of the major types of analyses that you could employ to answer certain commonly asked questions. As always, it is worth looking at the literature to see what types of analysis have been used in similar studies to the one you propose to do. There are several major groups of analysis based on the broad types of approach required.
Describing data
We need a variety of techniques to describe the data that we collect. This might be as a data exploratory technique (to check the data to see how variable a data set is, or what sort of distribution we get, etc.), to understand some aspects of the data (e.g. how diverse communities are), and for communication purposes (to be able to discuss the results, orally and in writing, with other people).
Here, simple plotting of measured variables on frequency histograms (or tables), cross‐tabulation of one (nominal) variable against another, and examining the range of the data (from the minimum to the maximum) may help to check for errors and ensure that we can chose the correct type of test for subsequent analysis. Extracting statistics, such as diversity indices to describe species richness, or evenness to describe how equal the proportion of species is within a community, can be important to assess what sort of community we have. Likewise, the estimation of population size or density might also be important. Similarly, we can use the average value of a variable to describe the magnitude of the majority of the data points (usually in conjunction with some measure of how variable the values are and how many data points were collected). These descriptive statistical techniques are reviewed later and more detail can be found in Wheater and Cook (2000, 2015).
Table 1.3Common statistical tests. Note that in each case, there are possible questions (and analyses) dealing with more than two samples and/or variables – see Chapter 5for further details.
| Example question | Null hypothesis | Type of test | Data required |
| Is there a difference between the number of birds found in deciduous woodlands and coniferous woodlands? | There is no significant difference between the number of birds in deciduous and coniferous woodlands. | Difference tests, e.g. a t test or a Mann–Whitney U test (p. 305). | Two variables: one nominal describing the woodland type and one based on either measurements (i.e. actual numbers) or on a ranked scale that describes the number of birds. |
| Is there a relationship between the number of birds and the size of the woodland? | There is no significant relationship between the number of birds and the size of the woodland. | Relationship tests, e.g. correlation analysis (p. 307). | Two variables: one (either measured or ranked) that describes the number of birds and one (either measured or ranked) that describes the size of the woodland. |
| Is there an association between whether birds are resident or not and whether the woodlands are deciduous or coniferous? | There is no significant association between the frequency of residency and the frequency of woodland type. | Frequency analysis, e.g. a Chi‐square test (p. 312). | Two variables: one nominal describing the residency status of the birds and one nominal describing the woodland type. |
Asking questions about data
If we wish to ask specific questions of the data, then we are in the realm of inferential statistics. These usually involve the testing of hypotheses. It is standard practice to set up a null hypothesis alongside the questions to be asked. The null hypothesis tests the chance of there being no significant difference between samples (or relationship between variables, or association between categories of variables). So if we wish to know whether there is a difference between two samples (e.g. comparing the number of birds found in deciduous woodlands with the number found in coniferous woodlands), then we actually test the null hypothesis that: there is no significant difference between the number of birds in deciduous and coniferous woodlands . Note that we are looking at ‘significant’ differences. These are differences that are unlikely to have resulted from random variation in the individual woodlands sampled. For this we need a method that tests the null hypothesis that there is no significant difference in the sample averages. In addition to difference tests between samples, there are also relationship tests between variables, and tests designed to examine associations between categories of variables. Table 1.3summarises some commonly used, relatively simple, statistical approaches to these research questions.
Since there are various questions that we might ask as part of an investigation, it is important to be clear about possible analysis methods in advance of any sampling. The choice of test depends not only on the question being asked, but also on the data types being used. Where data are ranked, but not measured (i.e. ordinal data – p. 27) then a suite of tests called nonparametric tests may be used. The alternative (using parametric tests) is more robust and generally preferred, but requires data to be on a measurement scale (i.e. interval/ratio data). Therefore, it is usually an advantage to obtain measurement data rather than to rank data wherever possible. Even where measurements are taken, parametric tests may not be the most appropriate. This is because most parametric tests require the data to conform to a type of distribution called a normal distribution. Briefly, this is determined by examining histograms of the data (with the variable of interest plotted on the x axis and the frequency of its occurrence on the y axis) to see whether they have a symmetrical pattern (see Figure 1.6). For further details about the shape of distributions, and of which test to use, see Chapter 5. There are also different tests depending whether the data are matched or unmatched (p. 305).
To illustrate some of the considerations in project design and data collection, we start with a research question that sounds relatively simple on the face of it: is there a relationship between the size of trees and the number of squirrels' dreys in the canopy of the trees? Ideally, we would want to measure the canopy height with some degree of accuracy. This would enable us to work out whether the relationship exists using a parametric statistical technique called Pearson's product moment correlation analysis (p. 308). However, it may be difficult even to see the tops of very tall trees and those obscured by other trees. Thus, we may estimate tree height, perhaps into several groupings. We can of course rank these data, but this means that we need an alternative approach for analysis that is suitable for ordinal data. This is Spearman's rank correlation coefficient analysis, which is not quite as powerful as the Pearson's method. The power of the test is its ability to detect a true relationship (or difference, or association) if one exists. If we knew that any such relationship was likely to be fairly weak, then the less powerful technique might not reveal it and we could be wasting our time in not measuring the trees relatively accurately to obtain measurement data and thus employ the more powerful test. Alternatively, if we are only interested in revealing strong relationships, then using ranked size classes to indicate tree height may be acceptable. The other complexities in this apparently simple question include ensuring that all other aspects are as constant as possible (e.g. species of tree, surrounding landscape, density of the squirrel colony, etc.).
Читать дальшеИнтервал:
Закладка:
Похожие книги на «Practical Field Ecology»
Представляем Вашему вниманию похожие книги на «Practical Field Ecology» списком для выбора. Мы отобрали схожую по названию и смыслу литературу в надежде предоставить читателям больше вариантов отыскать новые, интересные, ещё непрочитанные произведения.


Обсуждение, отзывы о книге «Practical Field Ecology» и просто собственные мнения читателей. Оставьте ваши комментарии, напишите, что Вы думаете о произведении, его смысле или главных героях. Укажите что конкретно понравилось, а что нет, и почему Вы так считаете.