Box 1.6 Terms used in sampling theory
See also the Glossary of statistical terms in Appendix 1.
A population is a collection of individuals, normally defined by a given area at a given time. For example, scientists refer to the decline in the world population of Atlantic cod in the last century or the annual harvest of Northeast Atlantic cod. These are both true populations. The size of a population is rarely measured directly but usually estimated from samples.
A sample is a term that can be used ambiguously, but is a subset drawn from a population, which usually includes a quantity. For example, 100 individual fish taken from the Northeast Atlantic cod population and measured in order to get an estimate of body size. Another example would be taking 50 small areas from a meadow (each 1 square metre in size) in order to count the number of plantains within them.
A parameter is a population metric that is estimated from a variable (e.g. the mean body size of Northeast Atlantic cod, or the mean number of plantains per square metre of a meadow) and can be used to summarise data. Importantly, statistical tests aim to estimate parameters from a population in order to test for differences, relationships, associations, etc.
A variable is a measurement that may change from sampling unit to sampling unit (e.g. the body size of Northeast Atlantic cod taken from a sample, or the number of plantains in a square metre of a meadow) and can be used to summarise collected data (e.g. by taking the mean).
The decision over which samples to take requires some care, and at this point it is worth discussing why replication is important. Since environmental systems are usually intrinsically variable (i.e. physical, chemical, and biological factors differ spatially and temporally), the larger the sample, then the more representative it will be of the population (i.e. the more of the natural variation will be covered). However, the larger the sample, the more time and effort it will take to collect it. There are methods to calculate the optimum sample size; however, these rely on knowledge of the variability of the system. This is rarely known in advance, although a small pilot study may give some indication. If it is known or suspected that there is substantial variability, then a large sample should be taken. In most ecological surveys, a large sample would include over 50 observations. However, where the population is likely to be very large and variation is expected to be great, even larger sample sizes may be required. Otherwise it is best to aim for as large a sample as possible after taking into account constraints including the size of the workforce, the time available, and how much material is present in the system under investigation. Sometimes, previous studies on similar topics can be used as a guide to what a reasonable sample size might be (i.e. from the literature or from a pilot study). Where several levels of a number of variables are to be analysed (e.g. male and female animals of each of three different age groups: young, mature, and old), then it is important to take sufficient replicates of each subgroup (e.g. young males, mature males, etc.) to be able to account for within‐group variability. This will inevitably have an impact on the required sample size and is another reason why the intended statistical analyses should be considered at an early stage of project planning. Box 1.7shows the factors that should be considered when determining the sample size.
Box 1.7 Aspects to be considered when determining the sample size
A larger sample size is needed when there is:
high variability – use a pilot study or consult similar investigations in the literature to get a feel for the likely variability;
a small difference or relationship or association to be detected – it is worth recognising that very small differences may not be important ecologically (e.g. a native plant may have more insect species than an introduced one, but if this difference is by only one or two common insects, it is unlikely to be of conservation importance);
a requirement to subdivide the data for analysis (e.g. separate analysis of males and females would require similar appropriate sample sizes of both males and females).
See Krebs (1999), van Belle (2002), and various online calculators 25 for further details of the different calculations that can be used to estimate sample sizes, depending on the intended statistical analysis technique to be used.
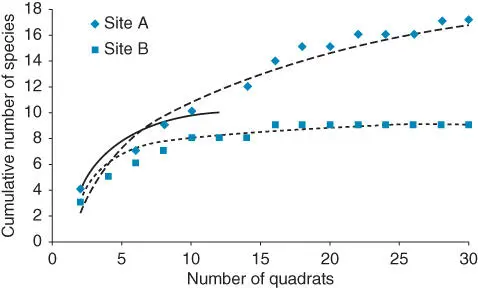
In surveys of community structure, it may be important to know that the majority of species in an area have been recorded at least once in your sample. In this case, species accumulation curves may help. At its simplest, this involves plotting the accumulated number of species against increasing sampling effort. Sampling effort is the number of sampling units (quadrats, pitfall traps, animals handled, hours of observations, sites surveyed, etc.). Box 1.8illustrates the use of species accumulation curves in quadrat sampling (see Chapter 3). There are a variety of methods of modelling species accumulation curves (see Colwell et al. 2004 and Magurran 2004 for further information) and many standard software packages include routines for this (e.g. those obtained from Pisces Conservation). 26
Box 1.8 Species accumulation curves for two sites
By plotting the cumulative number of species found against the number of quadrats examined, it can be seen that as the number of quadrats used increases, the number of species also increases. At the point at which the curve levels off towards the horizontal (the asymptote), we may assume that we have obtained the maximum number of species and can stop sampling. For site A (dashed line, diamonds), we may not yet have reached the total number of species, even after 30 quadrats, and should consider increasing the sampling effort. For site B (dotted line, squares), it appears that we have reached about the maximum number of species that we can expect to get. In fact, we probably reached this number at round about 16 or so quadrats. This difference between sites A and B might reflect not only a difference in the number of species found there, but also a difference in heterogeneity of the site, with site A being less homogeneous than site B. Note that had we looked at the data for site A after 12 quadrats (solid line, diamonds), we might have assumed that we had reached the maximum number of species as the curve levels off. This highlights the importance of collecting past the initial point of curve levelling to check that it truly does reflect the asymptote.

Since we generally take a sample in order to make a valid estimate of a parameter of the population (e.g. the number of species, the mean temperature, the proportion of predators), a central requirement is that the individuals sampled are independent of each other. It is important to recognise, and avoid or if not account for, situations where the individuals sampled are linked in some way as a result of the sampling design. For example, we might compare the number of spangle galls found on leaves chosen at random on oak trees growing in clumps, with those on isolated oak trees. If we found over 20 trees in separate clumps, but only 10 isolated trees, we might be tempted to take double the measurements from each of the individual isolated trees. However, this would mean that individual data points from isolated trees were linked by virtue of the tree on which they were growing and shared many different attributes with each other. Such data would not be independent of each other (known as pseudoreplicates) and hence may cause problems in interpretation since we would be unsure whether any differences between clumped and isolated trees were due to the multiple measurements from some trees. It would be better to use unbalanced sample sizes (i.e. 20 clumped and 10 isolated trees) than use non‐independent data. Similarly, we should not take data from more than one tree in any clump since these are likely to be more similar to each other than to those in other clumps. From a statistical analysis point of view, few tests require equal sample sizes and, even where this is a problem, it would be preferable to reduce the number of trees from clumps that were measured. Note that we may wish to take account of some of the variation between leaves on each tree by taking several (perhaps 10) leaves per tree and using a mean value to represent each tree. There are also statistical tests that allow for multiple measurements per tree, but these usually require the same number of samples per sampling unit – see repeated measures analysis in Chapter 5.
Читать дальше


