Jeremy M. Smallwood - The ESD Control Program Handbook
Здесь есть возможность читать онлайн «Jeremy M. Smallwood - The ESD Control Program Handbook» — ознакомительный отрывок электронной книги совершенно бесплатно, а после прочтения отрывка купить полную версию. В некоторых случаях можно слушать аудио, скачать через торрент в формате fb2 и присутствует краткое содержание. Жанр: unrecognised, на английском языке. Описание произведения, (предисловие) а так же отзывы посетителей доступны на портале библиотеки ЛибКат.
- Название:The ESD Control Program Handbook
- Автор:
- Жанр:
- Год:неизвестен
- ISBN:нет данных
- Рейтинг книги:5 / 5. Голосов: 1
-
Избранное:Добавить в избранное
- Отзывы:
-
Ваша оценка:
The ESD Control Program Handbook: краткое содержание, описание и аннотация
Предлагаем к чтению аннотацию, описание, краткое содержание или предисловие (зависит от того, что написал сам автор книги «The ESD Control Program Handbook»). Если вы не нашли необходимую информацию о книге — напишите в комментариях, мы постараемся отыскать её.
The ESD Control Program Handbook Chapter 6 deals with requirements for compliance given by the IEC 61340-5-1 and ANSI/ESD S20.20 ESD control standards.
Chapter 7 gives an overview of the selection, use, care and maintenance of equipment and furniture commonly used to control ESD risks. The chapter explains how these often work together as part of a system and must be specified with that in mind.
ESD protective packaging is available in an extraordinary range of forms from bags, boxes and bubble wrap to tape and reel packaging for automated processes. The principles and practice of this widely misunderstood area of ESD control are introduced in Chapter 8. The thorny question of how to evaluate an ESD control program is addressed in Chapter 9 with a goal of compliance with a standard as well as effective control of ESD risks and possible customer perceptions.
Whilst evaluating an existing ESD control program provides challenges, developing an ESD control program from scratch provides others. Chapter 10 gives an approach to this.
Standard test methods used in compliance with ESD control standards are explained and simple test procedures given in Chapter 11.
ESD Training has long been recognised as essential in maintaining effective ESD control. Chapter 12 discusses ways of covering essential topics and how to demonstrate static electricity in action. The book ends with a look at where ESD control may go in the near future.
The ESD Control Program Handbook Gives readers a sound understanding of the subject to analyze the ESD control requirements of manufacturing processes, and develop an effective ESD control program Provides practical knowledge, as well as sufficient theory and background to understand the principles of ESD control Teaches how to track and identify how ESD risks arise, and how to identify fitting means for minimizing or eliminating them Emphasizes working with modern ESD control program standards IEC 61340-5-1 and ESD S20:20
is an invaluable reference for anyone tasked with setting up, evaluating, or maintaining an effective ESD control program, training personnel, or making ESD control related measurements. It would form an excellent basis for a University course on the subject as well as a guide and resource for industry professionals.
The ESD Control Program Handbook — читать онлайн ознакомительный отрывок
Ниже представлен текст книги, разбитый по страницам. Система сохранения места последней прочитанной страницы, позволяет с удобством читать онлайн бесплатно книгу «The ESD Control Program Handbook», без необходимости каждый раз заново искать на чём Вы остановились. Поставьте закладку, и сможете в любой момент перейти на страницу, на которой закончили чтение.
Интервал:
Закладка:
Table 2.2Approximate capacitance of typical everyday objects.
| Electronic components and small assemblies | 0.1–30 pF |
| Drinks can, small metal parts | 10–20 pF |
| Tweezers held in hand | 25 pF |
| Small metal containers (1–50 l), trolleys | 10–100 pF |
| Larger metal containers (250–500 l) | 50–300 pF |
| Human body | 100–300 pF |
| Small signal MOSFET gate capacitance | 100 pF |
| Power MOSFET gate‐source capacitance | 900–1200 pF |
| Car | 800–1200 pF |
MOSFET, Metal Oxide Silicon Field Effect Transistor
A corollary of this is that the voltage and field surrounding a charged object may be suppressed by the presence of a nearby conducting object. If the capacitance of the system is increased, the voltage is decreased.
As an example, a charged garment that fits snugly to the body has voltage suppressed due to the proximity of its surfaces to the body. Even if the garment is highly charged, the external field may be limited due to this. If the garment flaps open, the body and garment surfaces move apart. “Capacitance” is reduced, and a high voltage and electrostatic field appears outside the garment.
2.3.3 Charge Decay Time
The resistance and capacitance form a resistor‐capacitor (RC) network that has a characteristic time constant τ .

In a time τ , the voltage will decay to about 37% of its initial value.
In the example, if the charge current is suddenly halted at time t = 0 with initial voltage V 0, the voltage V on the capacitor reduces as
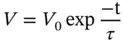
An electrostatic field meter monitoring the material surface would measure this exponential decay of voltage. The product of a material's resistivity ρ and permittivity ɛ 0 ɛ rgives a physical time constant for the material.

This behavior has important practical implications. If we consider a situation in which the capacitance is fixed at 100 pF (the order of magnitude of capacitance of a person) and the charging current 100 nA, we can consider the effect of different resistances. With a resistance of 1 GΩ, the voltage generated is only 100 V, and on cessation of the current, the voltage will fall to 37% of its initial value within 10 9× 10 −10= 0.1 seconds. The effect of a short duration charging current of this magnitude is unlikely to be noticed.
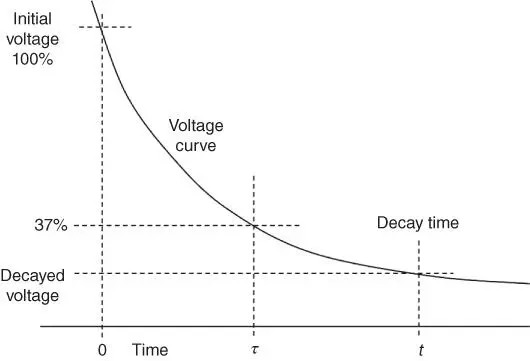
Figure 2.3Charge or voltage decay curve.
If the resistance is increased 10 GΩ, not only is the voltage generated increased to 1 kV, but on cessation of the current, the voltage will take 10 10× 10 −10= 1 seconds to fall to 37% of its initial value. The presence of this voltage may or may not be noticeable or cause a problem, depending on the circumstance.
If the resistance is increased 100 GΩ, not only is the voltage generated increased to 10 kV, but on cessation of the current, the voltage will take 10 seconds to fall to 37% of its initial value. The presence of this voltage for such a long time could lead to the person experiencing shocks on touching something or discharging to cause some problem.
In ESD control, a different definition of charge decay time is usually used in standard measurements, and often the time for charge to reduce to one‐tenth of its initial value is measured ( Figure 2.3). This value is theoretically equal to 2.3 τ .
In practice, the charge decay time is often measured from the starting voltage down to a certain threshold voltage, e.g. 100 V. Polymers may have time constants of many tens or hundreds of seconds, or even days under clean dry conditions.
In practice, the simple model does not always correspond well with material behavior. Measured charge decay curve may depart considerably from the ideal exponential, and the measured time “constant” varies with measurement conditions. Often with high resistance materials the decay time lengthens as the surface voltage drops and may become very long at low voltages.
2.3.4 Conductors and Insulators Revisited
In many engineering fields, conductors are often thought of as materials such as copper or aluminum that have very low resistance or resistivity (see Section 1.7), much less than 1 Ω. In ESD control, materials that have a much higher resistivity than this may be thought of as conductors. In practical electrostatic control, materials and equipment are often defined as conductors or insulators based on either a measured resistance or a charge decay time, or both. The model of Figure 2.1can be used to explain this.
As charge generation rate (current I ) in static electricity is often low, even a relatively high value of leakage resistance R ( Figure 2.1) may pass the current to give low voltage, V = IR . In ESD control, a resistance of 1 MΩ (10 6Ω) could be considered quite conductive and would reduce the electrostatic voltage in the previous example to 1 V. As an example, in a case where the charge generation currents normally experienced in practice are expected to be no more than 1 nA, calculations can be made on this basis. Alongside this, it may be wished to limit voltages to some level, e.g. 100 V. Given these constraints, the model and Ohm's law show that resistances up to V / I = 10 2/10 −9= 10 11Ω would be acceptable.
In an application (e.g. electrostatic hazards avoidance in industrial processes) where higher charge generation is expected, the allowable resistance may be considerably smaller (IEC 60079‐32‐1).
A second way of looking at the matter is to decide how long a transient charge built up on a material or object may tolerably be allowed to remain without problems occurring. This may be evaluated in terms of the charge decay time. If a conductor has capacitance around 10 pF, resistance to ground of 10 11Ω will give a charge decay time of one second, and in the absence of charge generation a stored charge will reduce to only 5% of its initial value within three seconds. In manual assembly and handling processes, this will usually be fast enough to avoid problems. For materials, this decay time corresponds to a permittivity of 10 −11Fm −1and resistivity of 10 11Ω. The permittivity of air is around 0.9 × 10 −11Fm −1, and many plastics are around 2 × 10 −11Fm −1. The presence of higher capacitance or material permittivity, or a requirement for faster charge decay, may lead to a lower maximum acceptable resistance.
2.3.5 The Effect of Relative Humidity
Water is an electrically conducting material. Moisture from the air forms a thin layer on the surface of many materials and can contribute to their apparent electrical conductivity. Some materials, especially natural materials such as paper, reduce by orders of magnitude in their resistivity as relative humidity increases from dry conditions.
As material surface resistance is increased under dry conditions, electrostatic charge build‐up is often greatly enhanced. Some ESD control materials use additives to attract moisture to a polymer surface and provide static dissipative behavior. These materials may not work well at low humidity. As a rule of thumb, electrostatic charge build‐up is generally increased for humidity less than about 30% rh.
Читать дальшеИнтервал:
Закладка:
Похожие книги на «The ESD Control Program Handbook»
Представляем Вашему вниманию похожие книги на «The ESD Control Program Handbook» списком для выбора. Мы отобрали схожую по названию и смыслу литературу в надежде предоставить читателям больше вариантов отыскать новые, интересные, ещё непрочитанные произведения.


Обсуждение, отзывы о книге «The ESD Control Program Handbook» и просто собственные мнения читателей. Оставьте ваши комментарии, напишите, что Вы думаете о произведении, его смысле или главных героях. Укажите что конкретно понравилось, а что нет, и почему Вы так считаете.