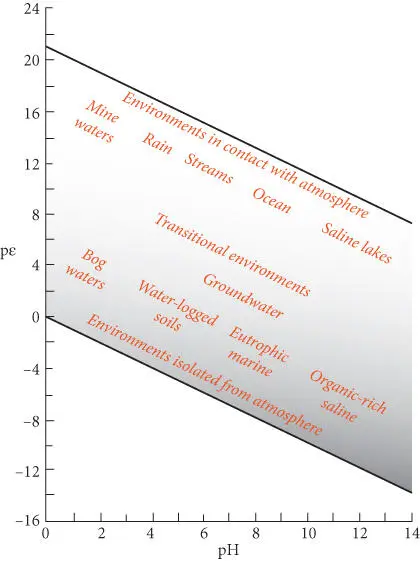
Figure 3.21 pε and pH of various waters on and near the surface of the Earth. After Garrels and Christ (1965).
Figure 3.21illustrates the pH and pε values that characterize a variety of environments on and near the surface of the Earth. Comparing this figure with pH–pε diagrams allows us to predict the species we might expect to find in various environments. For example, Fe 3+would be a significant dissolved species only in the acidic, oxidized waters that sometimes occur in mine drainages (the acidity of these waters results from high concentrations of sulfuric acid that is produced by oxidation of sulfides). We would expect to find magnetite precipitating only from reduced seawater or in organic-rich, highly saline waters.
Balancing redox reactions for pε–pH diagrams
While many redox reactions are straightforward, balancing more complex redox reactions for pε – pH diagrams can be a bit more difficult, but a few simple rules make it easier. Let's take as an example the oxidation of ammonium to nitrate. We begin by writing the species of interest on each side of the reaction:

The next step is to balance the oxygen. We don't want to use O 2gas to do this. We used O 2at a partial pressure of 1 to define the top boundary for the water stability region. Within the region of stability of water, the O 2concentration will be lower and we don't necessarily know its value. This is usually best done using water:

Next balance the hydrogen using H +:

Finally, we use electrons to balance charge:

As a check, we can consider the valance change of our principal species and be sure that our reaction makes sense. In ammonium, nitrogen is in the 3− state, while in nitrate it is in the 5+ state, a net change of 8. This is just the number of electrons exchanged in the reaction we have written.
3.11.2 Redox in magmatic systems
High-temperature geochemists use oxygen fugacity to characterize the oxidation state of systems. Consequently, we want to write redox reactions that contain O 2. Thus, equilibrium between magnetite and hematite would be written as:
(3.122) 
(or alternatively, as we wrote in eqn. 3.101) rather than the way we expressed it in eqn. 3.120. We note, however, there is negligible molecular oxygen in magmatic systems, and other species are often responsible for transfer of electrons and O 2–. For example, the equilibrium between magnetite and hematite may be mediated by water:
(3.123) 
The above two reactions are thermodynamically equivalent in terms of magnetite oxidation. The first reaction is simpler, of course, and hence preferred, but it may sometimes be necessary to consider the proportions of the actual gas species present.
If we can regard magnetite and hematite as pure phases, then their activities are equal to one and the equilibrium constant for reaction 3.122is the inverse of the oxygen fugacity:
(3.124) 
We can rewrite eqn. 3.86as:
(3.125) 
and taking the standard state as 1000 K and 1 bar, we can write:

Thus, oxygen fugacity can be calculated directly from the difference in the free energy of formation of magnetite and hematite at the appropriate T and P . Substituting appropriate values into this equation yields a value for log  of −10.86.
It is important to understand that the oxygen fugacity is fixed at this level (though the exact level at which it is fixed is still disputed because of uncertainties in the thermodynamic data) simply by the equilibrium coexistence of magnetite and hematite. The oxygen fugacity does not depend on the proportion of these minerals. For this reason, it is appropriately called a buffer. To understand how this works, imagine some amount of magnetite, hematite and oxygen present in a magma. If the oxygen fugacity is increased by the addition of oxygen to the system, equilibrium in the reaction in eqn. 3.121is driven to the right until the log of the oxygen fugacity returns to a value of −10.86. Only when all magnetite is converted to hematite can the oxygen fugacity rise. A drop in oxygen fugacity would be buffered in exactly the opposite way until all hematite were gone. A number of other buffers can be constructed based on reactions such as:


and


These can be used to construct the oxygen buffer curves in Figure 3.22.
Natural systems often contain multiple phases, many of which are solutions of several components; in this chapter, we developed the thermodynamic tools to deal with them.
We began by defining components, phases, and species. Together, the number of components and phases in a system determine the degrees of freedom of the system:(3.2) which are the number of independent variables we need to specify to completely describe the system. We derived the Clapeyron equation, which described the boundary between two phases, such as graphite and diamond, the P−T space: Figure 3.22 Oxygen buffer curves in the system Fe−Si−O at 1 bar. QIF, IW, WM, FMQ, and MH refer to the quartz–iron–fayalite, iron–wüstite, wüstite–magnetite, fayalite–magnetite–quartz and magnetite–hematite buffers, respectively.(3.3)
Читать дальше


 of −10.86.


